Inspecting a solution timeline
Select a solution from a list of recorded solutions in Insight Inspector. Use the event timeline under each entity type to examine recorded events and entities more closely.
About this task
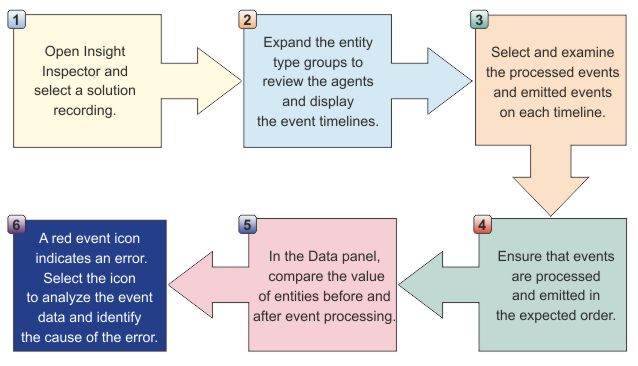
Procedure
- Using the solution and event timelines in the Insight Inspector window,
look at the number of processed events, the number of emitted events,
and the event processing errors. The following diagram
shows an example of the Insight Inspector window.

- Solution name and help icon
- The solution name in the banner area indicates the recording that you are currently reviewing. To learn more about Insight Inspector, click the help icon.
- Solution timeline
- By default, the last event in the recording is selected in the timeline. Click and drag the timeline to scroll back in time and see the beginning of the recorded solution.
- Entity
- Agents and events in the solution timeline are organized by entity type. In the example, there are two agents in the Account entity section.
- Agent
- Event icons appear on a timeline next to the agent or agents that process the events.
- Time flag
- The time flag appears above and behind the event icons in the timeline. The flag provides a marker to indicate the precise date and time when events are processed and emitted.
- Selected event
- You click an event icon to select a specific event in the timeline. The icon appears in a solid color to indicate that the event is selected. Details about the entities that are associated with the event are provided in the Data section.
- Selected event navigation
- When you select a single event in the timeline, the event name
is displayed in the horizontal bar between the timeline and the Data
section. If multiple events occur at the same time, then event icons
are stacked and you can click the event at the top of the stack. To
navigate to other events in the stack, click navigation arrows in
the area above the Data section. For example:

- Event attributes and entity attributes
- You can see detailed information about the attributes of the selected event in the Data section. In addition, the Data section shows entity attributes, including the initial value of an entity before the selected event is processed, and the final value of an entity after the event is processed.