Analyzing the order of events
Events are represented by icons on a horizontal timeline. You can expand and collapse entity type sections to control the display of events and agents that processed the events.
About this task
Events are represented by icons above and below a horizontal timeline. Processed events are
indicated by a round marker with a downward point, and emitted events are represented by a round
marker with an upward point. Stacked events are indicated by a curved line above the icon for
processed events, and below the icon for emitted events.
| Type of event | Event icon |
|---|---|
| Processed event, not selected | |
| Processed event, selected |  |
| Emitted event, not selected | |
| Emitted event, selected |  |
Procedure
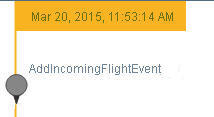
- To analyze the order of events, click to select an event
icon. For example:In this example, the selected event icon represents a single AddIncomingFlightEvent.
- Click to select a stacked event icon. If multiple events are processed for the same entity and agent at the same time so that the
events have the same time stamp, then the event icons are stacked on top of each other in the
timeline. For example:
 A stacked event has a label that describes the type of the top event on the stack, and number of events that are included in the stack. In the example, the event at the top of the stack has this label.
1 of 2, CausalEvent - Use the related events feature in the solution timeline
to help you validate that the incoming events are processed correctly
by all of the agents. You see more than one event icon
selected in the solution timeline because the selected events are
related. There are two types of event relationships that use this
feature:
- The event you selected is processed by more than one agent. The selected event icon is larger and all the other event icons that represent the same event are identified by a smaller icons.
- An additional related event is emitted by an agent when the event you selected is processed. The related event is emitted as a direct result of the selected event, so the secondary event is also selected. You see a visual indicator of the relationship between a processed event and an emitted events when both event icons are selected at the same time. The paired event icons help you understand the relationship between the events.
In this example, the AddxScheduledPassenger event is processed by the AirportCustomerAgent and also evaluated by the AirportFlightAgent. The AddxScheduledPassenger event icon is selected in the Customer timeline. The same event is also selected, as indicated by a smaller event icon, for the event in the Flight timeline at the same date and time. This feature makes it easy for you to see which agents processed the event and to validate that the business logic implemented by the solution agents is correct.

- Click to select a stacked event icon. If multiple events are processed for the same entity and agent at the same time so that the
events have the same time stamp, then the event icons are stacked on top of each other in the
timeline. For example: