InfoSphere Data Replication Dashboard
The InfoSphere® Data Replication Dashboard is a component of IBM® InfoSphere Data Replication that monitors the health of Q Replication and Event Publishing.
Moving graphs in the dashboard track real-time replication throughput, latency, and the fullness of message queues (queue depth). The dashboard summary helps you quickly identify and troubleshoot problems, and shows at-a-glance status information on programs, queues, Q subscriptions, and other objects.
Note: IBM intends to deprecate the InfoSphere Data Replication
Dashboard. IBM supports usage of the dashboard "as is" in the current release but is likely to
remove the function in a future release. The change will require each user to shift to a customer
self-supported sample, an open source community component, or both. Given this intention, it is
recommended that you use the asnmon program (Replication Alert Monitor) for setting up alerts to
notify you when replication-related events occur, and that you use the command tables IBMQREP_CAPCMD
and IBMQREP_APPLYCMD for operational tasks such as starting and stopping the replication programs,
managing Q subscriptions, or changing parameter values. See Data
Replication Dashboard - direction and usage for more details.
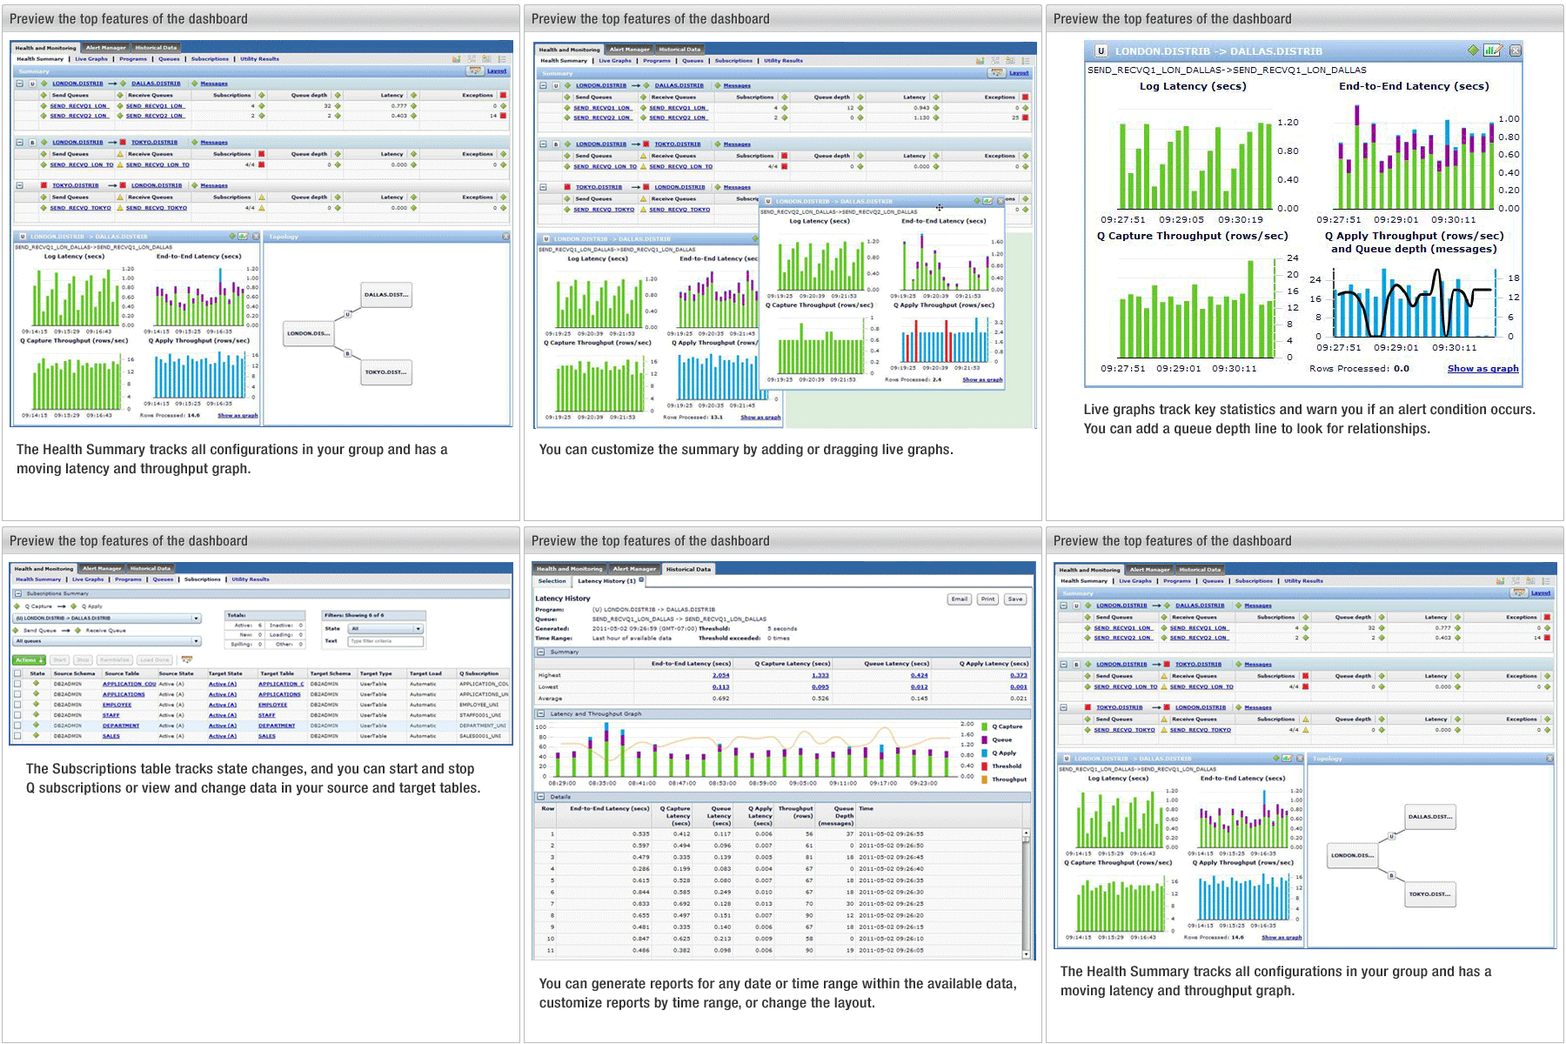
Figure 1 shows a series of screen captures that highlight some of the features of the dashboard.
Figure 1. InfoSphere Data Replication Dashboard at a
glance

The dashboard is available for download at http://www-01.ibm.com/support/docview.wss?rs=3557&uid=swg24023065.
The following list provides more detail on the features of the dashboard:
- Health summary
- The Summary tab helps you quickly assess these items:
- Q Capture and Q Apply status
- Send and receive queue status and queue depth
- Q subscription or publication status
- End-to-end latency
- Exceptions
- Error and warning messages from the replication programs
- Live monitoring
- You can view live graphs that display Q Capture and Q Apply throughput, log latency, and end-to-end latency. You can overlay graphs with IBM MQ queue depth trend lines to help you spot relationships between the number of messages on queues and the speed and volume of replication. Live graphs stretch to show a longer time frame, and you can hover over data points to see actual values. You can also select different layouts for the live graphs and customize the content for individual graphs.
- Q Capture and Q Apply programs
- From the Programs tab, you can view the current operating status of the Q Capture and Q Apply programs, view program statistics, and change the saved values of Q Capture and Q Apply properties.
- Queues
- From the Queues tab, you can view health statistics for each send queue and receive queue, including fullness of queues by number of messages or percentage of the maximum fullness (queue depth). You can start or stop send queues if the source database is DB2® Version 9.5 Fix Pack 3 or later. You can also use the Properties tab to view and change properties such as memory allocation and number of Q Apply agent threads.
- Subscriptions
- The Subscriptions tab shows you which Q subscriptions or publications are active, inactive, or loading, and alerts you to state changes. You can filter by Q subscription name or state to monitor subsets of your Q subscriptions. You can also start, stop, and reinitialize Q subscriptions and publications, signal when manual loading of target tables is done, and add columns to Q subscriptions or publications. Use the sample data feature on this tab to view and change the data in replication source and target tables. You can also run the asntdiff table compare utility from this tab if the source is DB2 for Linux or AIX®, or DB2 for Windows XP Version 9.7 Fix Pack 4 or above, and if a Secure Shell (SSH) server is running on the Windows computer.
- Reports
- On the Reports tab you can select configurations, queues, time ranges, and formats for viewing performance data about latency, exceptions, and program messages. The results are interactive and allow you to easily sort the data among various dimensions such as by server or by time. You can also view the contents of control tables, generate custom graphs based on performance statistics, save historical data as an HTML file, and email results.
- Alert Manager
- You can use the Alert Manager feature of the InfoSphere Data Replication Dashboard to send alerts to one or more email addresses when a threshold is exceeded or an event occurs. The dashboard can monitor your replication environment even when you are not actively logged in to the dashboard through the browser. You can receive email notifications for the following conditions: Q Capture program, Q Apply program, Q subscription, or receive queue becoming inactive; queues exceeding latency or queue depth threshold; Q Apply latency exceeding threshold; log latency exceeding threshold; exceptions on queues; any messages from the Q Capture or Q Apply programs; Q Capture and Q Apply memory usage exceeding a threshold; Q Capture processing a large transaction. You can also specify blackout periods if you do not wish to receive alert emails for a particular time, and also specify limits on the number of emails sent within a specified time period.
- Mobile device support
- You can use the InfoSphere Data Replication Dashboard on a mobile device. The mobile dashboard supports iOS 4.x or Android 2.2. You can access the mobile version from your dashboard server by using the regular dashboard login URL on the mobile device (https://hostname:portnumber/rdweb/login/login.html).