Scalability
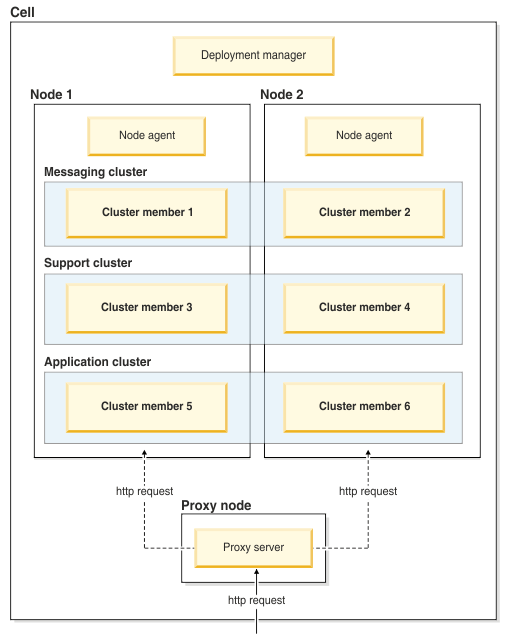
Installing IBM® Business Monitor components and monitor models to a cluster enhances your ability to manage their workload. Distributing the components and monitor models across multiple clusters, grouping components based on common resource usage patterns, enables you to manage the individual workload of each cluster based on the resource usage pattern of the installed components. See the "Three-cluster topology" topic for a suggested starting point when you are planning for a scalable topology.

Messaging engines
When deployed to a cluster, the messaging engine that is created for the IBM Business Monitor service integration bus is active on only one cluster member at a time. This behavior is specified by the default service integration bus policy. While the default service integration bus policy can be customized, the policy must always be of type "One-of-N." A "One-of-N" policy allows only one instance of the messaging engine to become active in a cluster, providing high availability (protecting components and models from the failure of a single server), but not scalability (the ability to expand as resources are added).
You can minimize use of the messaging engine and enable better performance by using the feature that allows the event source to bypass the use of Java™ Messaging Service (JMS) queues and directly submit events into the IBM Business Monitor database. For more information, see "Receiving events using table-based event delivery" in the related task links.
Support components
Support components include the event emitter services, action services, data services, REST services, Business Space, IBM Cognos® Business Intelligence server, and scheduled services. Except for the scheduled services, add new cluster members for increased capacity.
Most of the workload for the scheduled services occurs on the database server. As the workload of the scheduled services increases, monitor, evaluate, and tune the database server as needed. The workload of the scheduled services can also be managed by either enabling or disabling the various scheduled services or by editing the service intervals that are associated with each scheduled service. For more information, see "Managing Monitor scheduled services" in the related tasks links.
Applications
Monitor model applications are packaged as standard Java enterprise application archives (EARs). The monitor model application scales with the number of cluster members in the cluster.
The Applications cluster includes the mobile application and all your monitor model applications. Add new cluster members for increased capacity.
Memory considerations
The amount of memory available to a single cluster member depends on the address space layout of the operating system.
As a general guideline, consider adding a second cluster for deploying monitor model applications when you are deploying more than 10 monitor model applications. This is a guideline only, because individual workloads and models vary.
