Interpreting Process Monitor data
There are common assumptions people make when they look at Process Monitor data that might lead them to interpret their process performance incorrectly. Learn about the areas of Process Monitor where users are most likely to misinterpret what the data represents.
Completed Steps column
The completed steps column represents the current execution state of the process or service step that is received from the process engine. It means only that the process or service engine has completed execution of the step, but it does not mean the step itself is actually completed, as the step might be waiting for a response from a user or the system.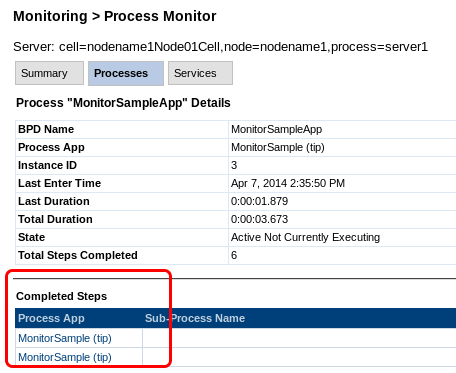
Process App column
The Process App column in the Active services table lists the process app or toolkit that contains the service at design time (in the Process Center); it is not the runtime process application. For example, in the following image, although the service Default Human Service is a task of the BPD instance at run time, it is shown as part of Coaches(8.5.5.0) because it is in the Coaches(8.5.5.0) toolkit.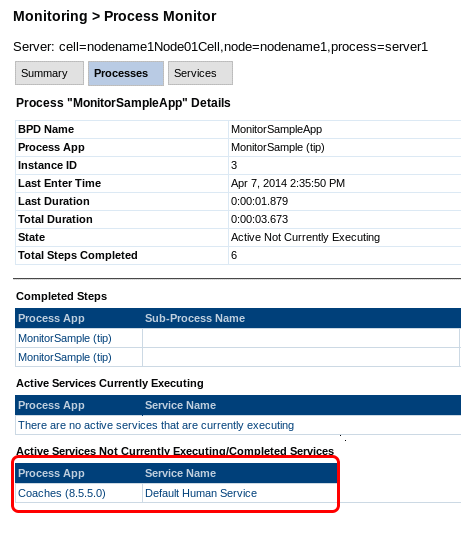
Total Steps count
The total steps that are shown in the Process Monitor do not correspond to the total number of steps as defined in the business process definition. The total steps count includes the number of times the service is generated, even when the user does not actually run the service. For example, if a Process Portal user starts a task that is a human service, the corresponding coach page appears. If the user closes the coach page immediately without clicking anything else, the step total increases by one.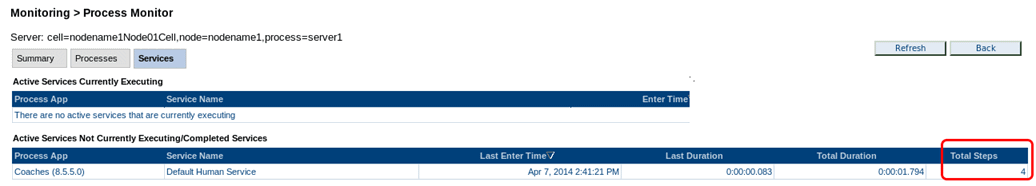
Halt process and halt service buttons
It is typically difficult to see the halt process and halt service buttons, as they appear only when the service is actually being executed by the engine. When you see these buttons, the process or service is typically running in a loop, or the service is taking a long time to run.Inconsistent monitoring data
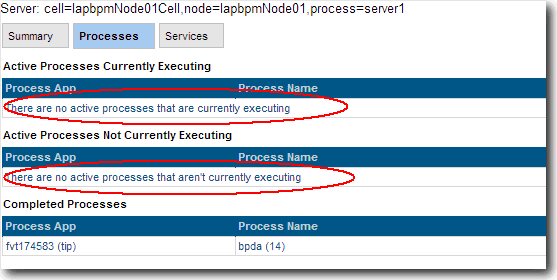
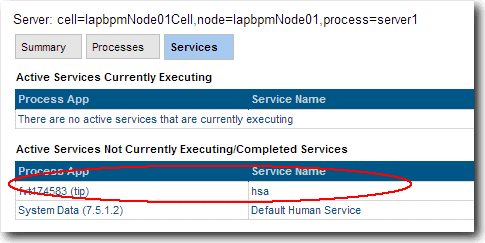
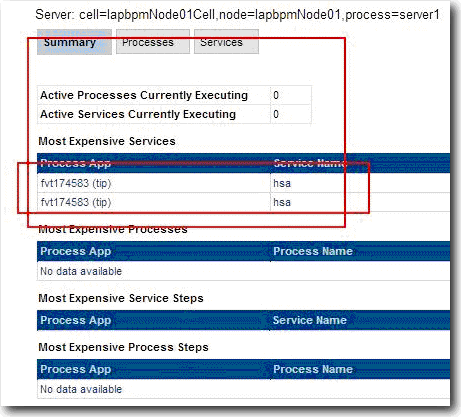
For example, the Processes page shows no active processes (Figure 1), but there are active processes in Process Portal, and the Services and Summary pages (Figures 2 and 3) show active process apps in the table.
- The system is not monitoring when the process instance is created.
- The system starts monitoring.
- The task in the process instance starts running.
Exit time calculation
If a process or service is still executing when it is exported, there is no exit time, and the system uses the current time as the exit time to calculate the duration. As you refresh the information on screen or through the JMX api, the duration time is updated. This explains why when a process or service that is executing is exported more than once, the duration time that shown in the exported file can vary.