To identify performance issues with your process application,
view the performance data available in the Process Monitor page
of the Process Admin Console. Identify process
applications that have bottlenecks, drill into the process application
to identify the steps that are expensive, and learn how long it takes
to run services.
Before you begin
In a network deployment environment, the Process Monitor is
server-specific. The monitor data is only kept in memory, and it is
specific to the Java virtual machine (JVM) process. To ensure that
you are looking at Process Monitor for the correct server, connect
directly to the IBM BPM server http or https port, instead of connecting
to an http server that might route you to any one of the underlying
IBM BPM servers.
About this task
Limitations
- All monitor and instrumentations data are kept in memory and only
show information about a particular cluster member. Restarting the
server clears the data. To view information across different cluster
members, connect to the deployment manager through a JMX console.
For more information, see Monitoring MBeans with JConsole
- The haltProcess() and haltService() methods might not always
be able to stop a process instance or service. The instance or service
stops only if it is currently being run by the process and service
engine, and is not stuck inside a service implementation (for example,
in the middle of calling a web Service or running JavaScript).
Procedure
To view the performance information for your process
apps and services:
- Log in to the Process Admin console, by entering the url. For example: http://servername:9080/ProcessAdmin,
where servername is the name of your server and
9080 is the default port.
- In the Server Admin area of the Process
Admin console, expand Monitoring to
list the available monitoring options.
- Click the Process Monitor option.
- Switch to the Summary page, which
provides an overview of active and most expensive processes and services.
- To view details of a particular process app, click the
process app. The Processes page opens showing
the details of the process app. You can view the duration of each
step in the process, including the type of activity, such as event,
gateway. You can also view the list of services that are running and
the total duration of each service. You can identify a service to
investigate, for example you might look at the service that is taking
the longest time.
- To view details of all active and completed process
apps, click Processes.
- Switch to the Services page and see
a list of all the service steps and their activity types. Here you
can identify the step, for example a coach, that is taking a long
time. You can now try to determine why that particular step has a
long duration. For example, you might notice that a particular coach
is taking a long time to complete, and when you re run the process,
the time might be significantly less, indicating that the performance
issue is most likely due to the initial loading of the model. On further
analysis, you might notice that there are numerous calls to stand-alone
Ajax services, which might affect the scalability and performance
of the coaches, and rework the process app so that the number of such
calls are minimized.
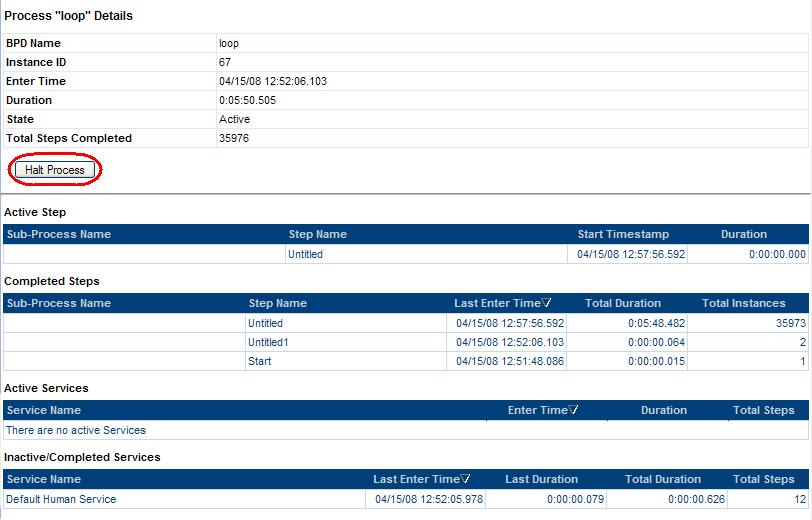
- To stop an active process:
- Click Processes.
- Under Active Processes Currently Executing,
click the name of the process that you want to stop.
- Click Halt Process.
Note: The Halt Process button
appears only if the process is currently running.
The halted process now appears in the Active Processes
Not Currently Executing list.
- To stop an active service:
- Click the Services option.
- Under Active Services Currently Executing,
click the name of the service that you want to stop.
- Click Halt Service.
Note: The Halt Service button
appears only if the service is currently running.
The halted service now appears in the Active Services
Not Currently Executing/Completed Services list.
 Note: The Halt Process button appears only if the process is currently running.
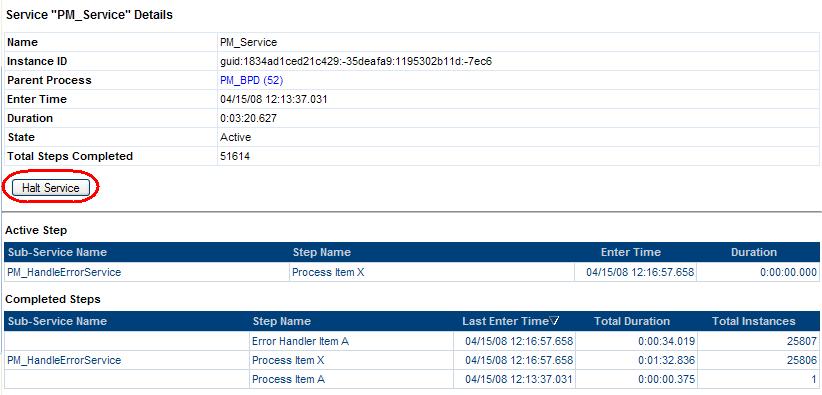 Note: The Halt Service button appears only if the service is currently running.