About this task
The data fields that have been promoted to the events table (for information about this, refer to Rational Integration Tester reference) are used to create the data source.
The following table outlines the different types of data sources that IBM Rational Integration Tester supports. (For more information about these data source-types, refer to Rational Integration Tester reference.)
| Data Source-Type | Produced by Recorded Events Wizard? | Description |
|---|---|---|
| File data source | Yes | This reads data from a file, for example, a comma-separated
value (CSV) file, a fixed width file, or some other delimited file-type. This data can be supplied to any tests or stubs in Rational Integration Tester. |
| Excel data source | No | This reads data from a worksheet in a Microsoft Excel workbook file. |
| Database data source | No | This reads data from a table in a database or the results of
a query on a database. Note: The database must be set
up in Rational Integration Tester’s
Architecture School perspective before this data source can be created.
|
| Directory data source | No | This reads in a set of files, for example, a set of XML documents. |
You can create a data-driven stub from recorded events or you can create a data source for a driven stub without using recorded events.
For example, you could create a stub by using the associated operation’s Message Exchange Pattern properties (for information about this, refer to Message exchange pattern (MEP) method) and then modifying the stub to read information from an Excel workbook file (with or without repeating elements), look up specified data, and then send any matching data in reply messages (for information about this, refer to Modifying message-based stubs).
To create a data-driven stub from recorded events:
Procedure
- Click the arrow button
(
 ) next to the Save Stub from selected events button
(
) next to the Save Stub from selected events button
( ) on the Events View toolbar and then click Save
Parameterized Stub on the shortcut menu.
) on the Events View toolbar and then click Save
Parameterized Stub on the shortcut menu. Alternatively, right-click the messages and click Save Parameterized Stub on the shortcut menu.
The Operation Assignment screen of the Recorded Events wizard is displayed.
The Operation Assignment screen, which is the third screen of the wizard, enables you to modify (if you want) the operation and the events associated with the stub.
Note: The first and second screens of the Recorded Events wizard are the Resource Type and Data Storage screens. The screens are displayed only if you click the Save button ( ) or press CTRL+S. Clicking the Save Stub from selected
events button () bypasses
the Resource Type and Data Storage screens.
) or press CTRL+S. Clicking the Save Stub from selected
events button () bypasses
the Resource Type and Data Storage screens.For information about using Operation Assignment screen, refer to Creating basic stubs.
Note: If you are creating a stub for multiple operations, Rational Integration Tester will attempt to verity that all selected recorded events are associated with the correct operations. - Clicking Next on
the Transaction Assignment screen displays the Column Mapping screen.
The Column Mapping screen enables you to map the fields in the selected recorded events to the data source that will be used for data-driven stubbing.
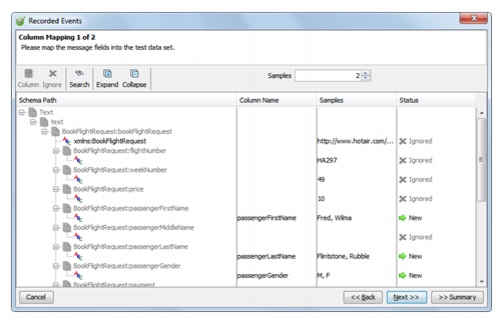
The following table describes how to use the Column Mapping screen.
To... Do this... Specify that a field in a recorded event will be a column in the data source 1. Select the field. 2. Click Column. The Map to column dialog box is displayed.
3. Click OK. For the selected field, New is displayed under Status.
Map a field in a recorded event to an existing column 1. Select the field. 2. Click Column. The Map to column dialog box is displayed.
3. In the list, click the column name to which you want to map the field.
4. Click OK.
Specify that a field in a recorded event is not mapped 1. Select the field. 2. Click Ignore.
Search for a specific data item in a recorded event 1. Click Search. 2. In the Find field (displayed on the lower half of the screen), enter your search query.
3. Press ENTER.
Increase or decrease the number of example values displayed for each field In the Samples box, enter or select the number of examples you want to display (default value: 2). Expand or collapse a node 1. Click the node. 2. Click Expand or Collapse (as applicable).
Close the wizard without making any changes Click Cancel. Move to the (previous) Transaction Assignment screen Click Back. Move to the next screen Click Next. Note: Another Column Mapping screen might display. The number of Column Mapping screens displayed by the Recorded Events wizard depends on the number of merged messages (which is determined by settings in the Transaction Assignment screen).Move to the (final) Summary screen of the wizard Click Summary. The Summary screen, which is the final screen of the Recorded Events wizard, enables you to review the configuration of the stub and to save the stub.
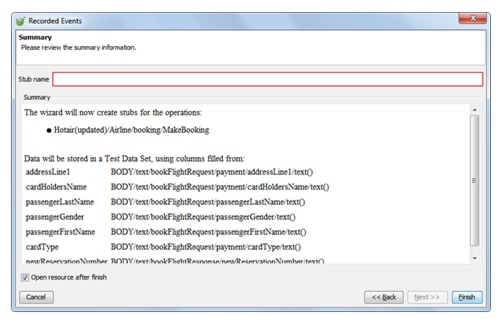
For information about using the Summary screen, refer to Creating basic stubs.
Results
After clicking Finish on the Summary screen:
- Rational Integration Tester’s Test Factory perspective is displayed, and the newly created stub and data source are displayed under the relevant logical resource on the Test Factory perspective’s component tree. If you created a stub for multiple operations, the stub is displayed under each applicable operation.
- If you selected the Open resource after finish check box on the Summary screen, the stub is also opened in the Stub Editor (for information about this, refer to Modifying message-based stubs). A Lookup Test Data action that uses the new data source is displayed on the Business Logic tab on the Events tab of the Stub Editor.