Troubleshooting
Problem
Memory Analyzer Tool (MAT) that can be added to the IBM Support Assistant (ISA) can be used to identify not only the leak suspects but also the name of the application causing the memory leak.
Symptom
Unbounded growth in heap size leading to OutOfMemory error.
Cause
Application memory leak.
Environment
A single application server can run multiple applications. Any one of the applications might be having a memory leak. Knowing the name of the application is helpful in identifying the development team that needs to be involved in resolving the memory leak.
Diagnosing The Problem
The Memory Analyzer Tool can analyze heapdumps as well as system dumps. The advantage of analyzing a system dump is that MAT can then display objects's contents as well, as opposed to heapdumps (.phd) files which only show the structure of the heap and the number of objects/classes it contains.
(Note: up to WebSphere v8.5, the system dump (.dmp) would have to be processed with jextract utility (becomes .dmp.zip) )
In the example below we used a jextracted system dump to get to the application's name;
as seen below, the leak has been identified as belonging to the thread "WebContainer : 10".
Example from MAT analysis:
Leak Suspects:
Problem Suspect 1
The thread com.ibm.ws.util.ThreadPool$Worker @ 0x2664f550 [HUNG] WebContainer : 10 keeps local variables with total size 240,899,544 (30.83%) bytes.
…
Once you have this information you can examine that thread's contextClassLoader field,
which points to the CompoundClassLoader which contains a "name" field which contains the WAR/EAR name of the application in question.
Note: if one installs the WAS extensions into MAT, then decoding the name field is done automatically and it shows right in the ContextClassLoader as per screenshot below:

...
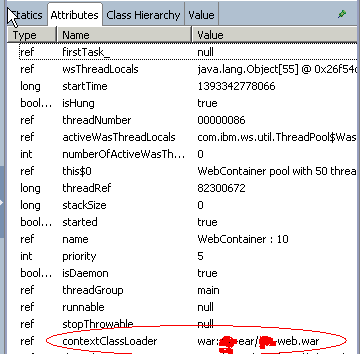
If you didn't install them, then you have to follow through one indirection, from the contextClassLoader content to the CompoundClassLoader to find its “name” field contents.

...
![]()
...

References: see links below.
Resolving The Problem
With above information, one needs to consult with the application's development team to resolve the memory leak.
Related Information
Historical Number
35226;7TD;000
Was this topic helpful?
Document Information
Modified date:
15 June 2018
UID
swg21673014