Transactions: Transaction Instances
This workspace enables you to view individual transaction instances. Use this workspace to isolate a particularly slow or failed transaction. Access this workspace by clicking a link icon in the table in the Transactions Summary workspace.
Using this workspace
A transaction instance is a single occurrence of a transaction within your system. The Transaction Instances workspace displays real-time data from your system for the last two or three aggregation periods, depending on your data collection settings. The default is for two aggregation periods to be used when Show Latest Instances is set to No. Three aggregation periods are used when Show Latest Instances is set to Yes.
The number of instances displayed in the workspace for each Transaction Collector and aggregation period is also determined by your data collection settings. The default is for TU_MAX_INITIAL_INSTANCE_IDS to be set to 5, so that the five fastest, slowest, median and failed instances are displayed in the workspace.
For further information about data collection settings, see Transaction Tracking agent data collection in the IBM Tivoli Composite Application Manager for Transactions Administrator's Guide.
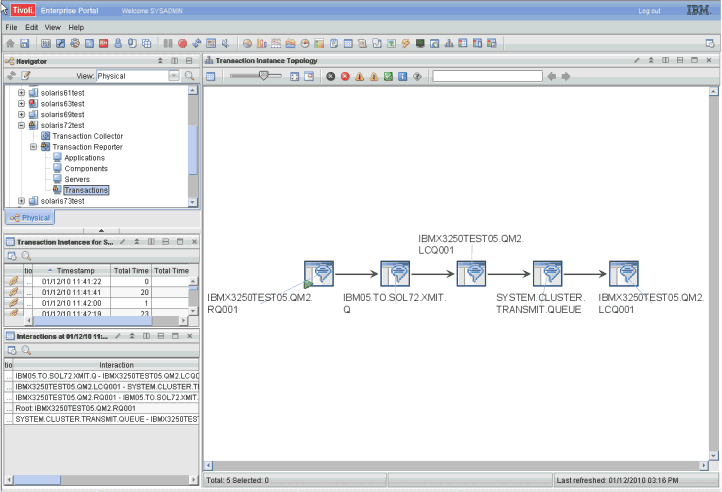
This workspace contains three views in addition to the standard Navigator view:
- Transaction Instance Topology
- Transaction Instances for transaction name
- Interactions
- Contexts

When you first enter this workspace, the Transaction Instance Topology does not display a topology. To display a topology, select a transaction instance from the table in the Transaction Instances for transaction name view and click Link to Instance Topology. It then displays the topology for a single instance of a transaction.
Use the Transaction Instances table in the Transaction Instances for transaction name view to select further details for a transaction instance by clicking on a link icon. When the screen refreshes, you will see a topology for that instance in the Transaction Instance Topology view. In addition, you will see further information on the transaction nodes involved in the transaction instance in the Interactions table in the Interactions view.
Table 1 describes the fields in the Transaction Instances for transaction name table.
| Column | Description |
|---|---|
| Instance Status | Indicates the status of the transaction instance:
|
| Total Time | Indicates the total time for the transaction instance, in milliseconds. |
| Total Time Deviation | Indicates the percentage deviation from a baseline value for the transaction instance. Positive numbers indicate a slower total time than the baseline value, and negative numbers indicate a faster total time than the baseline value. A deviation of zero indicates either that there is no deviation or that the deviation has not yet been measured. |
| Timestamp | Indicates the time a transaction instance started. |
The Interactions table in the Interactions view does not contain information when you first enter this workspace. To display information about the transaction instance nodes involved in a transaction instance, select a transaction instance from the table in the Transaction Instances for transaction name view and click Link to Instance Topology. The Interactions table then displays information about the transaction instance nodes for the selected transaction instance.
Table 2 describes the fields in the Interactions table.
| Column | Description |
|---|---|
| Instance Status | Indicates the status of the destination of the
transaction instance:
|
| Interaction | Indicates the two transaction instance nodes involved in the transaction instance. |
| Parent Sub Transaction Time | Indicates the sub-transaction time of the destination transaction instance as seen from the source transaction instance, measured in milliseconds. |
| Parent Sub Transaction Time Deviation | Indicates the percentage deviation of the parent sub-transaction time from a baseline value for the interaction. Positive numbers indicate transactions taking more time than the baseline value, and negative numbers indicate transactions taking less time than the baseline value. A deviation of zero indicates either that there is no deviation or that the deviation has not yet been measured. |
| Timestamp | Indicates the time a transaction instance started. |
| Enclosing Application | Enclosing application aggregate if applicable. |
| Enclosing Component | Enclosing component aggregate if applicable. |
| Enclosing Server | Enclosing server aggregate if applicable. |
The Contexts table in the Contexts view does not contain information when you first enter this workspace. To display context data for a specific transaction instance, select a transaction instance from the table in the Transaction Instances for transaction name view and click Link to Instance Topology. The Contexts table then displays context information for each node displayed in the topology.
Table 3 describes the fields in the Contexts table.
| Column | Description |
|---|---|
| Transaction | Displays the name of the transaction instance. |
| Name | Context Name field. |
| Value | Context Value field. |
Accessing this workspace
To display the instances of a particular transaction, click a link icon in the table in the Transactions view of the Transactions Summary workspace, and select the Transaction Instances workspace.
Links to other workspaces
From this workspace, you cannot link to another predefined workspace.