To collect custom data, configure your application codebase
with the Analytics API.
About this task
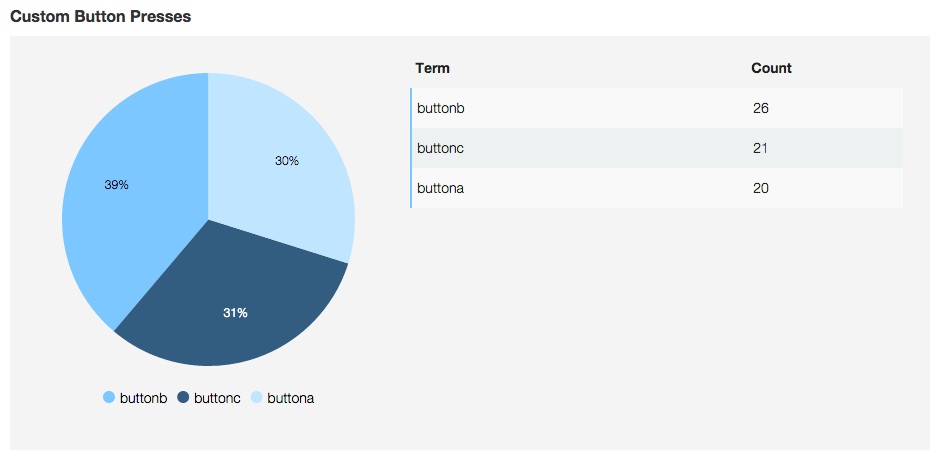
In this scenario, you create a pie chart that represents
the relative frequency of user button clicks.
Procedure
- Create a MobileFirst application.
For this scenario, attach functions to the JavaScript onClick event
listeners for buttons in your user interface. These functions are
instrumented to report analytics. The WL.Analytics.log method
takes an object and a message as parameters. The message is used for
searching for this custom event in the Search page
of the Analytics Console. The object is used to collect data for custom
analytics charting.
function buttonA(){
  var event = {buttonPress: 'buttona'};
  WL.Analytics.log(event, 'Custom event for button A press');
}

function buttonB(){
  var event = {buttonPress: 'buttonb'};
  WL.Analytics.log(event, 'Custom event for button B press');
}

function buttonC(){
  var event = {buttonPress: 'buttonc'};
  WL.Analytics.log(event, 'Custom event for button C press');
}

function sendAnalytics(){
  WL.Analytics.send();
}
The sendAnalytics function
is a convenience for demonstration purposes only. The values for keys
that are passed to the WL.Analytics.log method
can be strings and numbers only. Objects and arrays can be passed
as values, but are not used during custom charts creation. The event object in each method is
used to create custom charts. The buttonPress key
is used to generate data for each chart. The values for this key are buttona, buttonb,
and buttonc.
- Create a custom chart. For more information about custom
charts, see Creating a custom chart.
Figure 1. Chart
Definition
When a device sends the analytics to
the server, the key becomes available in the Select Property field
for chart creation and filters.