Analog Gauge widget
Analog Gauges are used to visually represent a numeric quantity within specified minimum and maximum values. Analog Gauges can be displayed as full gauges or half-moon gauges.
Analog Gauge visualizations
Analog Gauges are displayed as full gauges by default, in edit mode an administrator can instead specify that the gauge be displayed as a half-moon gauge with its status ranges shown on its rim. Both visualization options are shown in Table 1.
The Analog Gauge provides a number of visual cues to assist dashboard users in quickly assessing the status of a displayed value, including varying the gauge color and displaying a status icon. In edit mode, an administrator can specify value ranges for each visualization type. For example, a gauge that reads 0 - 100 can be configured to display a status of critical (red background) for values that are in the range of 80 - 89.
| Status type | Standard Visualization | Half-Moon Visualization |
|---|---|---|
| Informational - This status is displayed when the displayed value is within the specified informational range for the parameter that is being monitored. While the status is not normal, it generally does not indicate that a problem exists. | 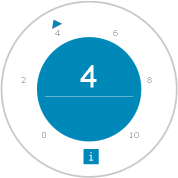 |
 |
| Normal - This status is displayed when the displayed value is within the specified normal range for the parameter that is being monitored. |  |
 |
| Minor - This status is displayed when the displayed value is within the specified minor abnormal range for the parameter that is being monitored. While the status does not indicate a major issue, it indicates that the reading should not be ignored. |  |
 |
| Major - This status is displayed when the displayed value is within the specified major abnormal range for the parameter that is being monitored. While the status is not critical, it indicates that the reading should not be ignored and that action may be required to prevent a critical situation. |  |
 |
| Critical - This status is displayed when the displayed value is within the specified critical range. A critical reading indicates that action is necessary to restore normal conditions. |  |
 |
| Fatal - This status is displayed when the displayed value is within the specified fatal range. |  |
 |
Unknown - A gauge can display this status for a number of reasons:
When an Analog gauge shows a status of Unknown, the value output field displays Unknown. A status of Unknown often indicates an error condition. When you hover your cursor over the gauge a tooltip provides details of the error. Important: The Analog gauge does not
start to work again when the connection to the data provider is restored.
The gauge must be refreshed by the refresh timer or browser reload
widget, or you must manually relaunch the page.
|
 |
 |
| Threshold Strip - Instead of a changing background color, in edit mode the Analog gauge can be configured to show all statuses at once. In this case, the configured statuses are shown as a multicolored strip around the rim of the gauge. The background color of the gauge does not change. |  |
Extra Analog Gauge information
- Top or leading-edge label
- An Analog Gauge can be configured to display a label to provide more information on the parameter that is being monitored. An administrator can configure two labels for a gauge. These labels can be displayed above the gauge or at the gauge’s leading edge. The leading edge label depends on the browser locale as some languages are read from right to left, so in those cases the label is displayed on the opposite side of the gauge. A label can display parameters from the data source, or custom content.
- Gauge graduations
- Gauge graduations are configured in edit mode. Within the overall value range, a series of major and minor graduation ticks and their frequency can be specified.
- Value not in range
- When a value is outside the specified value range, the value output field displays the value. If the value is lower than the specified value range, then the gauge needle points to slightly below the minimum graduation tick. If the value is greater than the specified range, the needle points to slightly higher than the maximum graduation tick.
- Real-time data
- If the data provider sends dynamic updates, the Analog Gauge display updates to show real-time data. The Analog Gauge also responds to the Refresh Timer widget events and it then displays the latest data.
- Interaction
- Events - An Analog Gauge can publish events to which other widgets can subscribe and react accordingly. Similarly, Analog Gauges can subscribe to events published by other widgets and update based on the published event information. An event is triggered when a user clicks a widget. The widget that is clicked publishes an event that sends the current context for the publishing widget. Widgets that subscribe to the clicked event may or may not update depending on the information that is contained in the event.
- Page Launch - In edit mode, an administrator can
configure the Analog Gauge to open a discrete Dashboard Application Services Hub dashboard or page, when
the gauge is clicked.Note: The Page Launch function overrides the standard "clicked on" function. That is, if the widget is configured to launch another page or dashboard when it is clicked, then it does not create an event that sends data to other widgets.