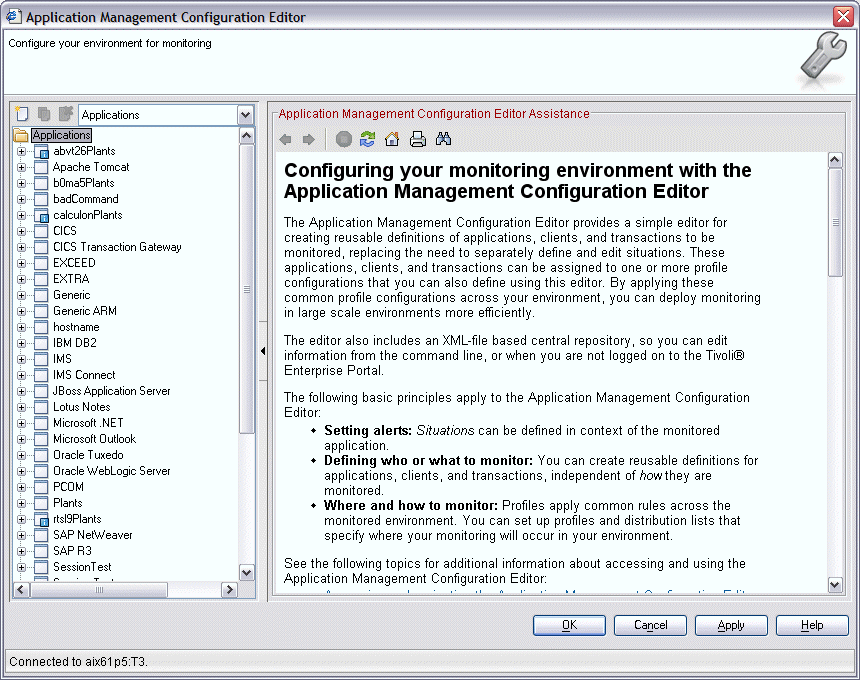
Accessing and navigating the Application Management Configuration Editor
You can access the Application Management Configuration Editor from
the Tivoli Enterprise Portal.
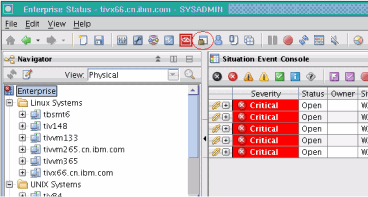
From the main toolbar, select the ![]() Application Management Configuration Editor icon.
Application Management Configuration Editor icon.
The Application Management Configuration Editor is displayed in a separate window, similar to the following example.
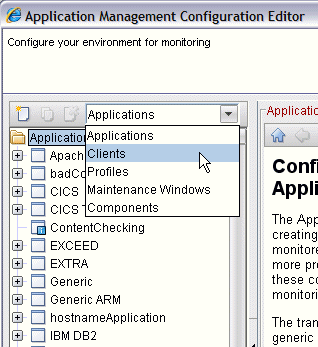
Switching views
- Applications
- Clients
- Profiles
- Maintenance Windows
- Components
Displaying Application details
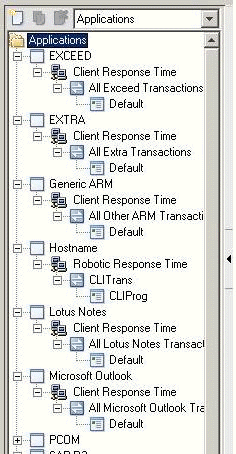
In
the default Applications view, you can click ![]() to expand the node tree next to each application
name, and display transactions (denoted by the
to expand the node tree next to each application
name, and display transactions (denoted by the ![]() icon), sorted by agent type (such as Robotic Response
Time, Transaction Tracking, and Web Response Time). Default applications
are provided for each agent type (except for Robotic Response Time).
You can also expand the transaction nodes to display any associated
profiles (denoted by the
icon), sorted by agent type (such as Robotic Response
Time, Transaction Tracking, and Web Response Time). Default applications
are provided for each agent type (except for Robotic Response Time).
You can also expand the transaction nodes to display any associated
profiles (denoted by the ![]() icon).
icon).
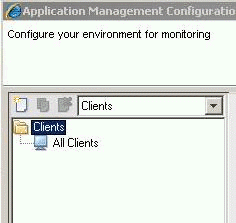
Displaying Clients
From
the navigation view, when you click ![]() and
select the Clients option, the list of previously defined clients
is displayed, similar to the following example:
and
select the Clients option, the list of previously defined clients
is displayed, similar to the following example:
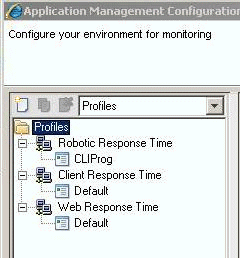
Displaying Profiles
From
the navigation view, when you click ![]() and
select the Profiles option, the list of previously defined
profiles is displayed, similar to the following example:
and
select the Profiles option, the list of previously defined
profiles is displayed, similar to the following example:
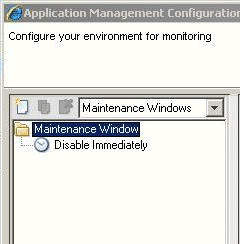
Displaying Maintenance Windows
From
the navigation view, when you click ![]() and
select the Maintenance Windows option, the list of previously
defined maintenance windows is displayed, similar to the following
example:
and
select the Maintenance Windows option, the list of previously
defined maintenance windows is displayed, similar to the following
example:
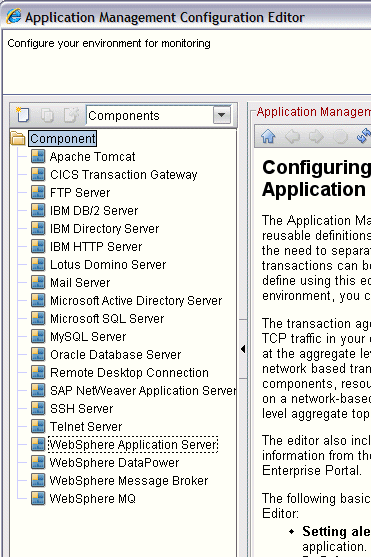
Displaying Components
From
the navigation view, when you click ![]() and
select the Components option, the list of previously defined
components is displayed, similar to the following example:
and
select the Components option, the list of previously defined
components is displayed, similar to the following example:
Clearing the Java Plugin Cache
- Access the Windows Control Panel.
- Select IBM® Control Panel
for Java.
- Select the General tab.
- In the Temporary Internet Files section, click Delete files.
- Click OK.
- Select Java Plug-in.
- Select the Cache tab.
- Click Clear.
- Click Apply.