Virtual I/O Server Performance Advisor reports
The Virtual I/O Server (VIOS) Performance Advisor tool provides advisory reports that are related to performance of various subsystems in the VIOS environment.
The output generated by the part command is saved in a .tar file that is created in the current working directory.
The vios_advisor.xml report is present in the output .tar file with the other supporting files. To view the generated report, complete the following steps:
- Transfer the generated .tar file to a system that has a browser and a .tar file extractor installed.
- Extract the .tar file.
- Open the vios_advisor.xml file that is in the extracted directory.
The vios_advisor.xml file structure is based on an XML Schema Definition (XSD) in the /usr/perf/analysis/vios_advisor.xsd file.
| Performance metrics | Description |
|---|---|
| Measured Value | This metric displays the values that are related to the performance metrics collected over a period. |
| Recommended Value | This metric displays all the suggested values when the performance metrics pass the critical thresholds. |
| First Observed | This metric displays the time stamp when the measured value is first observed. |
| Last Observed | This metric displays the time stamp when the measured value is last observed. |
| Risk | If either the warning or the critical thresholds are passed, the risk factor is indicated on a scale of 1 - 5 with 1 being the lowest value and 5 being the highest value. |
| Impact | If either the warning or critical thresholds are passed, the impact is indicated on a scale of 1 - 5 with 1 being the lowest value and 5 being the highest value. |
- System configuration advisory report
- CPU (central processing unit) advisory report
- Memory advisory report
- Disk advisory report
- Disk adapter advisory report
- I/O activities (disk and network) advisory report
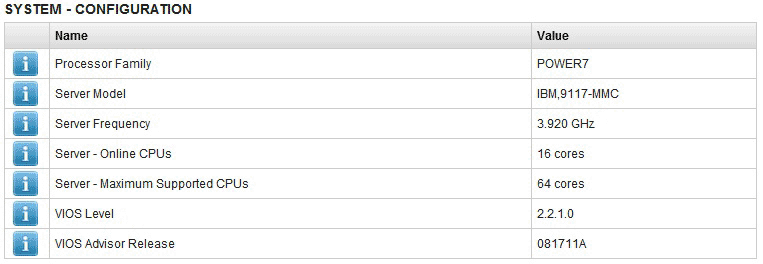
The system configuration advisory report consists of the information that is related to the VIOS configuration, such as processor family, server model, number of cores, frequency at which the cores are running, and the VIOS version. The output is similar to the following figure:

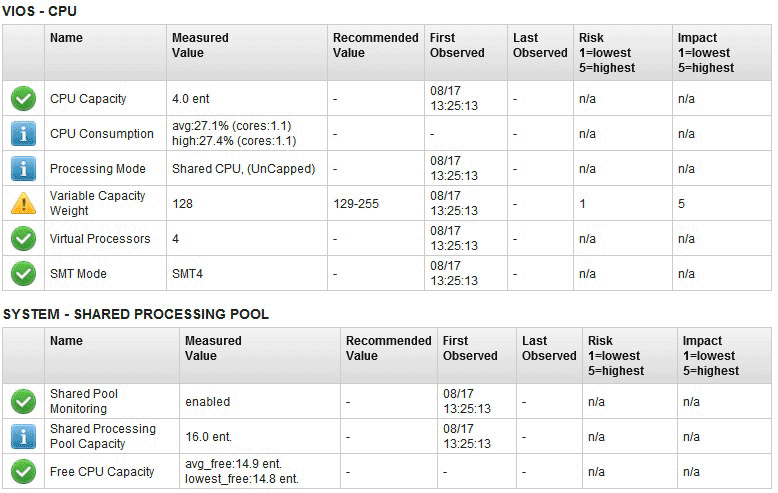
The CPU advisory report consists of the information that is related to the processor resources, such as the number of cores assigned to the VIOS, processor consumption during the monitoring interval, and shared processor pool capacity for shared partitions. The output is similar to the following figure:

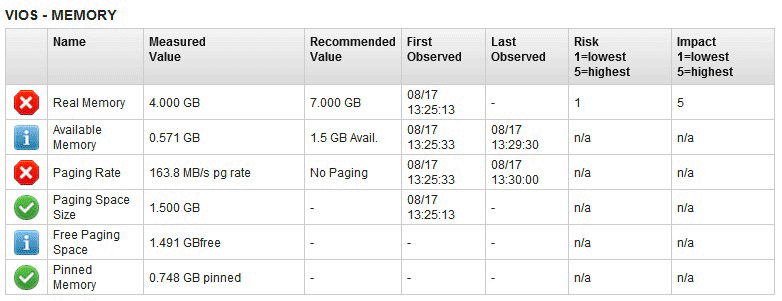
The memory advisory report consists of the information that is related to the memory resources, such as the available free memory, paging space that is allocated, paging rate, and pinned memory. The output is similar to the following figure:

The disk advisory report consists of the information that is related to the disks attached to the VIOS, such as the I/O activities that are getting blocked and I/O latencies. The output is similar to the following figure:

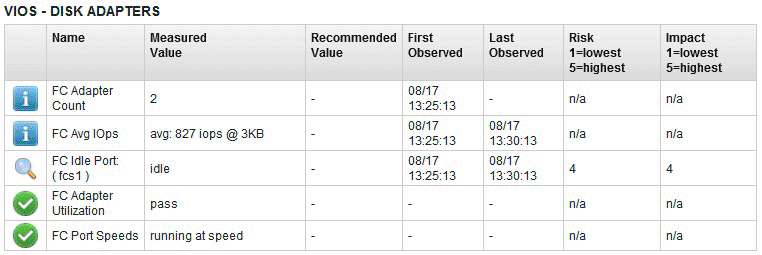
The disk adapter advisory report consists of information that is related to the Fibre Channel adapters that are connected to the VIOS. This report illustrates the information that is based on the average I/O operations per second, adapter utilization, and running speed. The output is similar to the following figure:

- Disk I/O activity, such as average and peak I/O operations per second
- Network I/O activity, such as average and peak inflow and outflow I/O per second
The output is similar to the following figure:

The details related to these advisory reports can also be obtained by clicking the respective report fields from the browser. The following details are available for all the advisory reports:
- What Is This: Brief description of the advisory field
- Why Important: Significance of the particular advisory field
- How to Modify: Details related to the configuration steps that you can use to modify the parameters that are related to the particular advisory field
| Icons | Definitions |
|---|---|
 |
Information related to configuration parameters |
 |
Values acceptable in most cases |
 |
Possible performance problem |
 |
Severe performance problem |
 |
Investigation required |