Question & Answer
Question
Net present value (NPV) is calculated based on the expected returns and the expected costs of an investment, where these expected returns and expenses are discounted by a rate that reflects inflation and opportunity costs. This Tech Note describes an example how to calculate the Net Present Value (NPV) for a project in Rational Portfolio Manager.
Answer
Net Present Value (NPV) is calculated by the following formulas:
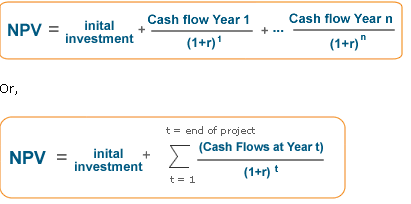
Where r is the discount rate and t is time (year).
Note: In Rational Portfolio Manager there is no special field for the initial project Investment value.
Rational Portfolio Manager ignores the discount rate for the first year of the project.
There are many different ways to calculate NPV using Rational Portfolio Manager, this technote will discuss only one method.
In order to calculate a more accurate NPV in Rational Portfolio Manager than what is provided out-of-the-box, a project manager could enter the
initial investment money as a Worksheet expense for the previous year for which his project would start. The following example shows how to do this.
The project starts on January, 1st 2007 and will finish on December 31, 2009. Project financial data includes:
Initial Investment: $50,000
Discount rate: 10%
Cash flow (in dollars) for the year 2007: 2,000
Cash flow for the year 2008: 10,000
Cash flow for the year 2009: 75,000
In order to work around the behavior for the first year (see note above as to what this behavior is), create a project with start date in the year 2006 (instead of 2007).
To do this in Rational Portfolio Manager:
Create a new proposal:
- Drag and the proposal icon from the main menu to the portfolio
- Give the proposal a name and press Enter
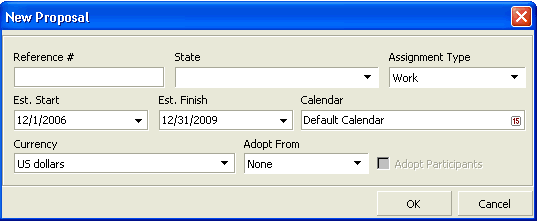
- In the New Proposal dialog box set the start date to December 1, 2006 and set the end date to December 31, 2009.
- Set the other fields based on your process.
- Click OK

Open the description view for the newly created proposal:
- Highlight the proposal and click Description from the buttons located at the top of the GUI or Double click on the proposal
- Check out the view.
- Click the check out button located in the upper right corner of the Description View layout
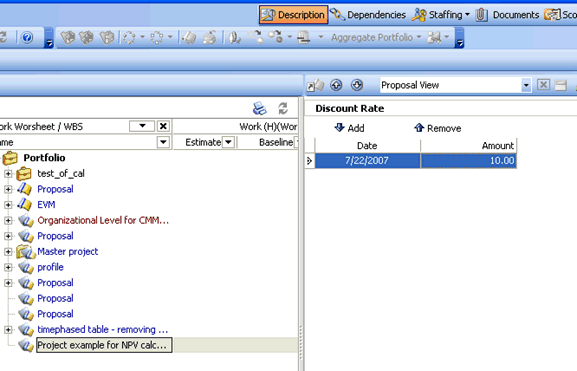
- Expand the Discount Rate portlet (you may need to customize the layout to include this portlet)
Select Add then enter the Date and Discount Rate (as a percent):
The actual date doesn't matter as long as it is in the first "real" year of the project.
In this example the date is 7/22/2007 and the amount (of the Discount Rate) is 10%.
For the date portion - select the date from the calendar; the date itself is unimportant - in any version 7.1 and lower, this date field is a place holder and is not used in the calculation.
For the discount rate - enter 10
Minimize the Discount Rate portlet click the minimize button on the Discount Rate header bar.
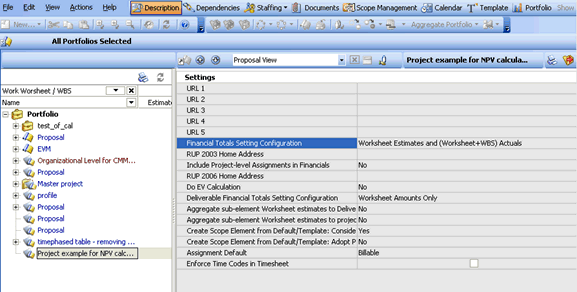
Verify that the Project Financial Total settings is set to Worksheet Estimates and (Worksheet+WBS) Actuals:
- Expand the Settings portlet in the Description view
- Find the Financial Totals Setting Configuration field and see if it is set to Worksheet Estimates and (Worksheet+WBS) Actuals
If this is not set to this, then click on the field (the Description View must be checked out) and from the pull down menu select this option. - Close (or minimize) the Settings portlet - click the minimize button on the Settings header bar.
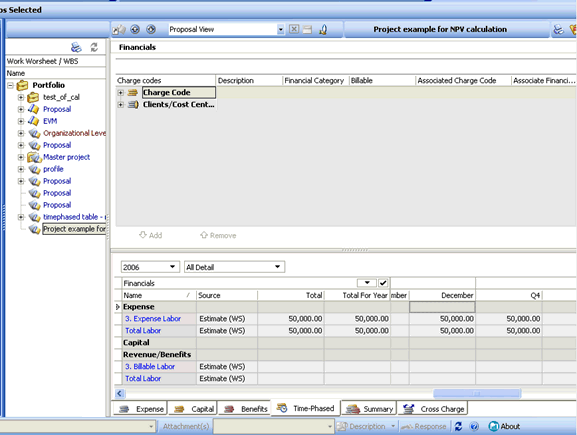
For the year 2006 enter the "Initial Investment" dollar figure as a Worksheet Expense. The Initial investment for this example is 50,000.
Expand the Financials portlet (click the Full page button located on the Financials banner) ,
Select Time-Phased tab (located at the lower edge of this portlet)
Set the year to 2006 and show "All Detail," these pull down menus are located at the top left corner of the Financials layout
In the December column for Expense "Expense Labor" type 50000
Note: The Expense could be any type of expense, this example is using Expense Labor.
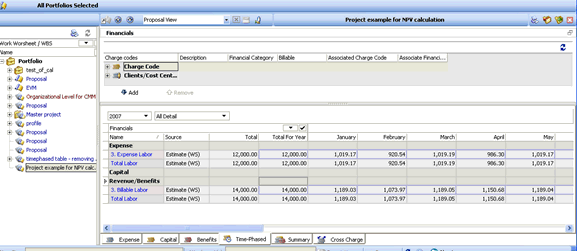
Cash flow is determined by taking the total expenses and subtracting them from the total benefits. In our example the total expenses are 12,000 and the total benefits are 14,000.
This gives a cash flow for the year of 2,000:
The formula used is Total benefits - Total expenses = Cash Flow
To set the cash flow for the year 2007:
- Select the Date field (located below the Financials title or Add button depending on which expanded view your using) and from the drop down menu select 2007
To do the actual calculation in Rational Portfolio Manager:
- Type 12000 in the Total For Year field for Expense Labor (you must have the Description View checked out), the tool will automatically distribute this expense over the year based on the number of days in the month.
- Type 14000 in the Total for Year field for Billable Labor.
- Rational Portfolio Manager will calculate the Cash Flow.
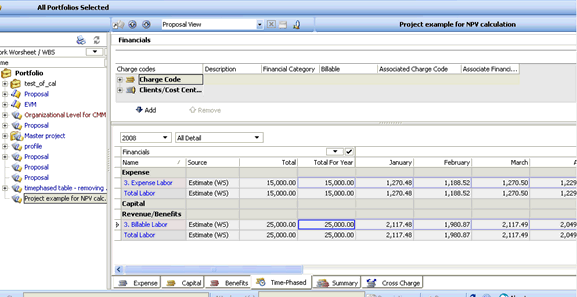
Set the cash flow for the year 2008 for 10,000:
- Set the year 2008 - select the Date field (located below the Financials title or Add button depending on which expanded view your using) and from the drop down menu select 2007
- Type 15000 in the Total For Year field for Expense Labor (you must have the Description View checked out), the tool will automatically distribute this expense over the year based on the number of days in the month.
- Type 25000 in the Total for Year field for Billable Labor.
- Rational Portfolio Manager will calculate the Cash Flow.
Set the cash flow for the year 2009 for 75,000:
- Set the year 2009 - select the Date field (located below the Financials title or Add button depending on which expanded view your using) and from the drop down menu select 2007
- To do this in the tool, type 82000 in the Total For Year field for Expense Labor (you must have the Description View checked out), the tool will automatically distribute this expense over the year based on the number of days in the month.
- Type 119000 in the Total for Year field for Billable Labor.
- Rational Portfolio Manager will calculate the Cash Flow.

Check in your changes:
- Select the Check in button located in the upper right corner of the Description View layout.
Based on this example the NPV calculation is:
- NVP = -50000 +2000/(1+0.1) + 10000/(1+0.1)^2 + 75000/(1+01)^3
- NVP = - 50,000 +1818.20 + 8264.46 + 56348.61
- NVP = 16431.27
To verify this in Rational Portfolio Manager:
- Select the Project in the Work Management View (you may need to close the Description View) and select the Portfolio button in the upper right of the GUI.
- On the Dashboard select OLAP Pivots > Finance > Finance Assessment
- Locate the NPV (Financial Totals) column (you may need to customize and add this to your pivot table). The total will display 16,431.25.

As indicated earlier, this is just one method of figuring the net present value using Rational Portfolio Manager.
Was this topic helpful?
Document Information
Modified date:
16 June 2018
UID
swg21267225