Troubleshooting
Problem
An OutOfMemoryError may occur in WebSphere Application Server with stack frames in com.ibm.ws.session.*.
Symptom
Here is the top of an example OutOfMemoryError stack for this type of problem (note that some stack frames may differ based on session replication versus persistence and other factors):
java.lang.OutOfMemoryError: Java heap space
    at java.util.Arrays.copyOf(Arrays.java:3580)
    at java.io.ByteArrayOutputStream.grow(ByteArrayOutputStream.java:129)
    at java.io.ByteArrayOutputStream.ensureCapacity(ByteArrayOutputStream.java:104)
    at java.io.ByteArrayOutputStream.write(ByteArrayOutputStream.java:164)
    at java.io.ObjectOutputStream$BlockDataOutputStream.drain(ObjectOutputStream.java:1962)
    at java.io.ObjectOutputStream$BlockDataOutputStream.flush(ObjectOutputStream.java:1907)
    at java.io.ObjectOutputStream.flush(ObjectOutputStream.java:739)
    at java.io.ObjectOutputStream.close(ObjectOutputStream.java:760)
    at com.ibm.ws.session.store.db.DatabaseHashMapMR$1.run(DatabaseHashMapMR.java:264)
    at com.ibm.ws.session.store.db.DatabaseHashMapMR$1.run(DatabaseHashMapMR.java:252)
    at java.security.AccessController.doPrivileged(AccessController.java:650)
    at com.ibm.ws.session.store.db.DatabaseHashMapMR.handlePropertyHits(DatabaseHashMapMR.java:252)
    at com.ibm.ws.session.store.db.DatabaseHashMap.persistSession(DatabaseHashMap.java:2146)
    at com.ibm.ws.session.store.common.BackedHashMap.updateSession(BackedHashMap.java:552)
    at com.ibm.ws.session.store.common.BackedHashMap.put(BackedHashMap.java:626)
    at com.ibm.ws.session.store.common.BackedSession.flush(BackedSession.java:239) [...]
Cause
In most cases, if the Java heap size (-Xmx) is sized properly, the cause of this type of OutOfMemoryError (OOM) is that an application has placed too much data into an HttpSession or there are too many sessions of too large of a size for the configured -Xmx.
In some configurations for session persistence or replication, sessions are periodically persisted or replicated on a WebSphere background thread. Although such threads are not application threads, WebSphere is simply serializing or replicating application sessions, so the underlying issue is still most likely proximately related to application data rather than WebSphere.
The stack trace of the OOM may be found either in the auto-generated javacore*.txt file on IBM Java, or in some cases, may be printed into the SystemOut*.log, SystemErr*.log, HPEL, or messages.log files.
Diagnosing The Problem
Review the resulting heapdump produced by the OOM to understand which application is driving it and which particular session keys and values:
First, ensure that the correct heapdump is produced when the OOM occurs:
- For IBM Java, there are two types of heapdumps: PHD and system dump. The latter is an operating system dump of the entire virtual address space (e.g. core dump, minidump, SVCDUMP, etc. depending on operating system) and is a superset of a PHD. We recommend analyzing the system dump instead of the PHD because you will see much more detail about the cause of this type of OOM. In recent versions of IBM Java, both types of heapdumps are requested on the first OOM by default; however, some operating systems (most often, Linux, AIX, etc.) have a default configuration that suppresses core dumps. In those cases, ensure that the core and file ulimits are set properly on Linux and AIX before starting the JVM.
- For HotSpot Java, there is one type of heapdump: HPROF. The JVM must be started with the option -XX:+HeapDumpOnOutOfMemoryError to produce an HPROF dump on OOM.
Next, load the heapdump (core dump or HPROF) into the IBM Memory Analyzer Tool.
For IBM Java system dumps and recent HPROF heapdumps (but not PHDs), the heapdump will include stack information, so open the threads view.
The first thread is usually the one that caused the OOM. Review the "Retained Heap" column to understand how much memory each thread is retaining. If there is a single large session, then the first thread will likely be much larger than the others. If many large sessions across threads contributed to the OOM, then you will probably see many pretty large retained heap sizes.
Expand the large retained heap size rows and explore the stack frame locals on the thread. In particular, find frames such as "com.ibm.ws.session.store.db.DatabaseHashMap.persistSession" and expand them to find the actual session object such as DatabaseSession:
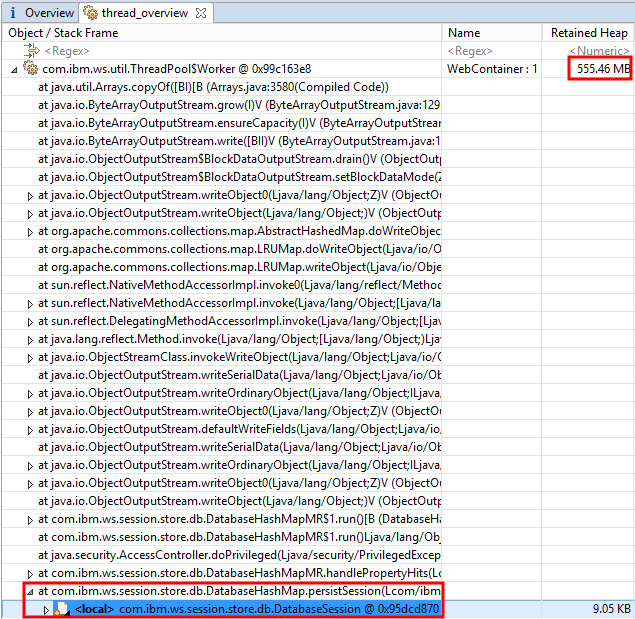
Copy the address of the session object (in the above example, 0x95dcd870).
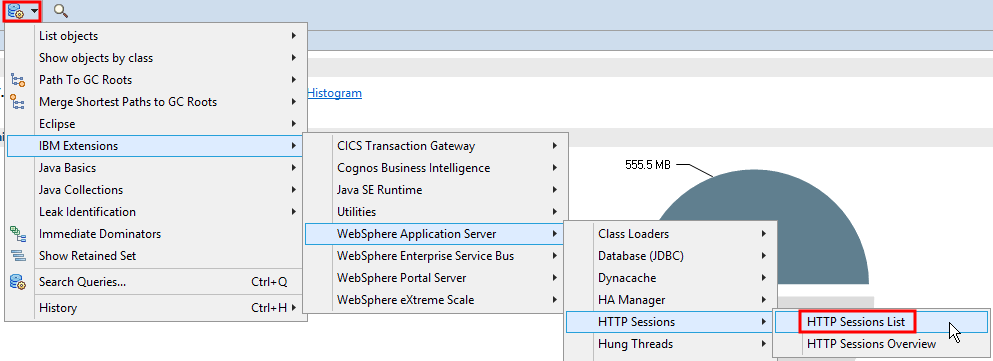
Open the Sessions List query:
In place of "<Regex>" in the "Class Name" column of the first row, paste in the address of the session object from above and press Enter to filter the sessions to that particular session, and then expand the row to show the keys and values:
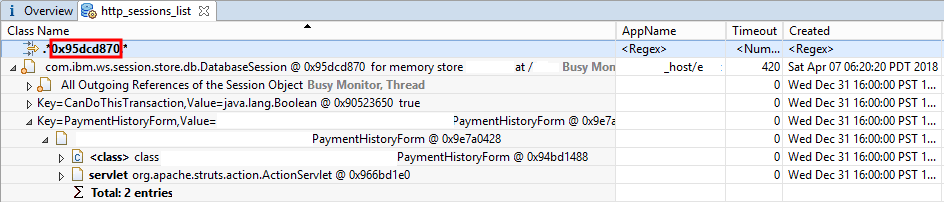
Some details have been masked but you can see that various details of the session will be available such as the application name, timeout, creation and last update times, JSESSIONID, and more.
The expanded session will show Key= and Value= for each Key/Value pair in the session and each such row may be expanded to show the Value object.
Note that the "Retained Heap" column of sessions or their values may not be very meaningful because they have inbound references from the ObjectOutputStream. Application code analysis is sometimes required.
The top two stack frames are often in java.util.Arrays.copyOf and java.io.ByteArrayOutputStream.grow because the ObjectOutputStream tries to double its underlying byte array when it has run out of space; therefore, if you plan to simply increase -Xmx, consider that the session will be at least twice its reported "Retained Heap" size in the dump.
The HTTP Sessions List query is part of the free IBM Extensions for Memory Analyzer Tool. It will work with all dump types, including PHDs. In the case of PHDs, the HTTP Sessions List query will show retained sizes of all sessions. If a dump is gathered manually outside of OOM conditions, if there is no session persistence or replication at the time of the dump, then the retained sizes of sessions will be more meaningful and the distribution of session sizes may be analyzed.
Resolving The Problem
- Understand why some sessions are too large.
- If session usage is by design, then modify the application to reduce session usage.
- Consider horizontally scaling the application cluster to reduce the session load per JVM.
- Otherwise, if all other conditions are expected, increase -Xmx. (In the case that the serialization is excessive, as in the example above, then increasing -Xmx will not help.)
-
In the above example, the reason why WebSphere was serializing this session into more than 555MB is that the session included an application object which had a value that had an instance field reference to its org.apache.struts.action.ActionServlet. Serializing the actual servlet object will serialize a very large object graph. In this case, the application needs to be modified with custom serialization to avoid serializing this field:
"Classes that require special handling during the serialization and deserialization process must implement special methods with these exact signatures:
private void writeObject(java.io.ObjectOutputStream out) throws IOException
private void readObject(java.io.ObjectInputStream in) throws IOException, ClassNotFoundException;
private void readObjectNoData() throws ObjectStreamException;"
For example:
private ActionServlet servlet;
private String notificationEmail;

private void writeObject(java.io.ObjectOutputStream out) throws java.io.IOException {
  // Do NOT call defaultWriteObject because we want to avoid writing the `servlet`
  // field. All other fields important to the application must be written below.
  // out.defaultWriteObject();

  // Here write out any actual fields that should be serialized using either writeObject
  // or the other write* methods for primitive fields
  out.writeObject(notificationEmail);
}

private void readObject(java.io.ObjectInputStream in) throws java.io.IOException, ClassNotFoundException {
  // Deserialization to read in the expected fields in the same order as above
  notificationEmail = (String) in.readObject();
}

private void readObjectNoData() throws java.io.ObjectStreamException {
  // no-op
}
Was this topic helpful?
Document Information
Modified date:
17 September 2018
UID
ibm10730535