Implementing your own information governance reports with the SQL views of InfoSphere Information Governance Dashboard

You can create information governance reports that are based on SQL views, models, and queries. These reports give you deeper insight into your information governance by identifying more useful forms and patterns in your information assets and metadata.

Before you begin

Make sure you have patch CMS RU2 installed on your system for up-to-date SQL views.

About this task

You can follow a standard pattern for developing information governance reports that is often found in development projects. You start with an investigative phase to assess needs, followed by an explorative phase that concerns feasibility and implementation options. You implement these options in the final phase. After verification and deployment, you can repeat this entire process, incorporating user feedback into the first phase to improve the overall solution.

You can use the SQL views from IBM® InfoSphere® Information Governance Dashboard to enable real-time reporting on the metadata repository. Except for enumeration tables, the fact and dimension entities are implemented based on these views. Analytical queries reference them directly rather than through a data mart or data warehouse.

Because an extra persistence layer is not required, there is zero latency between results of analytical queries and the data they are based on. One limitation to this approach is that the SQL views join various tables from the metadata repository. Although the SQL views hide this detail, it becomes apparent if multiple views are joined for analytical queries. Such queries can become rather complex in terms of the tables that they operate on, which might lead to slow response times or ultimately prevent them from running.

Procedure

  1. Identify the basic requirements and parameters of your reporting solution by answering these types of questions:
    • Which roles or users have a need for information governance reporting?
    • What are the reporting needs of these roles and users? Some examples of these needs are answers to the following questions:
      • Does the quality of supplier contact records meet a specific target?
      • How many records from a certain information asset, such as a table, miss a defined data quality standard?
      • Do all key information assets have owners?
      • How many information governance policies have information governance rules assigned?
    • What are the underlying metrics and key performance indicators (KPIs)?
    • What data and metadata is required to compute these metrics?
    • How do these users expect the metrics to be visualized?
  2. Define the reporting needs in terms of the available metadata.
    Based on the reporting needs identified in Step 1, make sure that the required data is present and properly modeled in IBM InfoSphere Information Governance Catalog and that it is accessible through the SQL views. You define the reporting needs in terms of this metadata and specify the metrics and KPIs of interest. You must have a detailed understanding of the available metadata and how it is used to represent business entities of interest. This understanding includes having the answers to the following questions, among others:
    • Are the required data sources represented in the catalog?
    • What catalog objects are used to represent business entities of interest, for example, terms, categories, information governance policies, and information governance rules?
    • What types of relationships are available to connect which types of entities?
    • Does the catalog use extensions, such as custom attributes or external entities? What are they used for?
    • Are categories or information governance policies modeled as hierarchies? What is the maximum depth of these hierarchies?

    You can use some of the queries that are defined in the example Reporting on the metadata in your metadata repository to answer these types of questions. The answers help identify an effective approach to a reporting solution.

  3. Create a dimensional model, define your queries, and then, based on those queries, define your reports.

    Define a data model to be used for reporting. This data model is based on the data sources that are identified in Step 2. Because you might not be able to anticipate some of the reporting needs, the reporting data model must be as flexible as possible in terms of metrics and calculations that can be performed. One well-established method to make analytical data available for processing is to use a dimensional model that consists of facts that provide the core data and dimensions. These core data and dimensions enable viewing and exploring the data from different perspectives that are based on various analytical queries and computations.

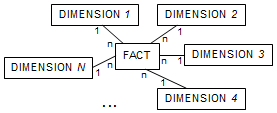
    The standard topology for a dimensional model is the star schema where a fact entity is associated with various dimension entities that have a 1:n relationship to the fact.

    Star schema diagram

    In a standard data warehouse environment, these entities are tables that are populated by ETL processes. These processes extract the data that are needed for reporting from the operational systems in certain regular intervals and store them in the corresponding fact and dimension tables. In InfoSphere Information Governance Dashboard, facts and dimensions are represented by analytical queries which are based on the SQL views.

What to do next

In the examples provided in these topics, which all follow this standard development pattern, key facts are identified and dimensions are gradually added. By using these example facts and dimensions, you can create reports that derive deeper insights from a technical and business perspective. The examples typically consist of these elements:
  • A model fragment that shows the contributing views and relationships between these views
  • An analytical query in the form of SQL statements
  • An example of the result output in a simple list format
Reports typically contain a mix of different visual elements, such as pie or bar charts that provide a better way to present analytical results to a certain community. The Cognos reports that are delivered with InfoSphere Information Governance Dashboard provide examples for some typical reporting needs, whereas you can use these examples to create your own reports based on the SQL views.
The following diagram conventions are used in these topics:
  • Boxes (tables that consist of one column) represent entities (views or tables).
  • Arrows represent relationships between entities.
  • A dashed line represents an optional relationship (outer join).
  • The direction of the arrow represents an n:1 (solid) or n:0 (dashed) relationship.
  • A line without an arrowhead represents a 1:1 (solid) or 1:0 (dashed) relationship.
  • A box with a double border represents a 'bridge view'.