As an administrator, use Insight Monitor to check that your runtime servers are
running as you expect. The interface provides information useful to troubleshoot your cluster.
About this task
Insight Monitor provides useful
information to troubleshoot your runtime servers if the cluster is not running as you expect. The
Events page shows the number of events, a list of the event types, and the
rate at which they are processed. The event load can also be viewed by its distribution across the
cluster. The Memory and CPU pages provide information
about the capacity allocation usage and how much processing is being consumed by the servers.
Procedure
- In the menu bar, select Event to display the three Event submenus:
Note: The Event pages display event totals from when the runtime server was
started. If a server is restarted, the event counts is reset. The event counts also includes time
triggers, which the system schedules, so it can be higher than expected.
- Click Event Rates to view the events rates. The event rates give
information about the actual number of events that are processed per second based on the most
current information available.
- Click Event Distribution to view the event distribution across all of
the runtime. The distribution is a percentage calculated by the event count per server divided by
the total number of events processed.
- Click Event Count to view the total number of events processed per
server. The event counts also include retries of event processing as a result of processing errors.
- Click Memory to view the memory utilization.
It shows the total, used, and free heap usage on each server. It indicates whether the system is
running low on Java heap. If the memory usage is near the configured amount, you might want to add
more RAM and increase the size of the Java virtual machines.
- Click CPU to view the CPU utilization.
It displays the central Processing Unit (CPU) percentage that the server is using. It shows that
the system is running efficiently. If the system has a high event rate, the CPU utilization must be
near 100%, which indicates that the system is processing the backlog of events as quickly as
possible.
Example
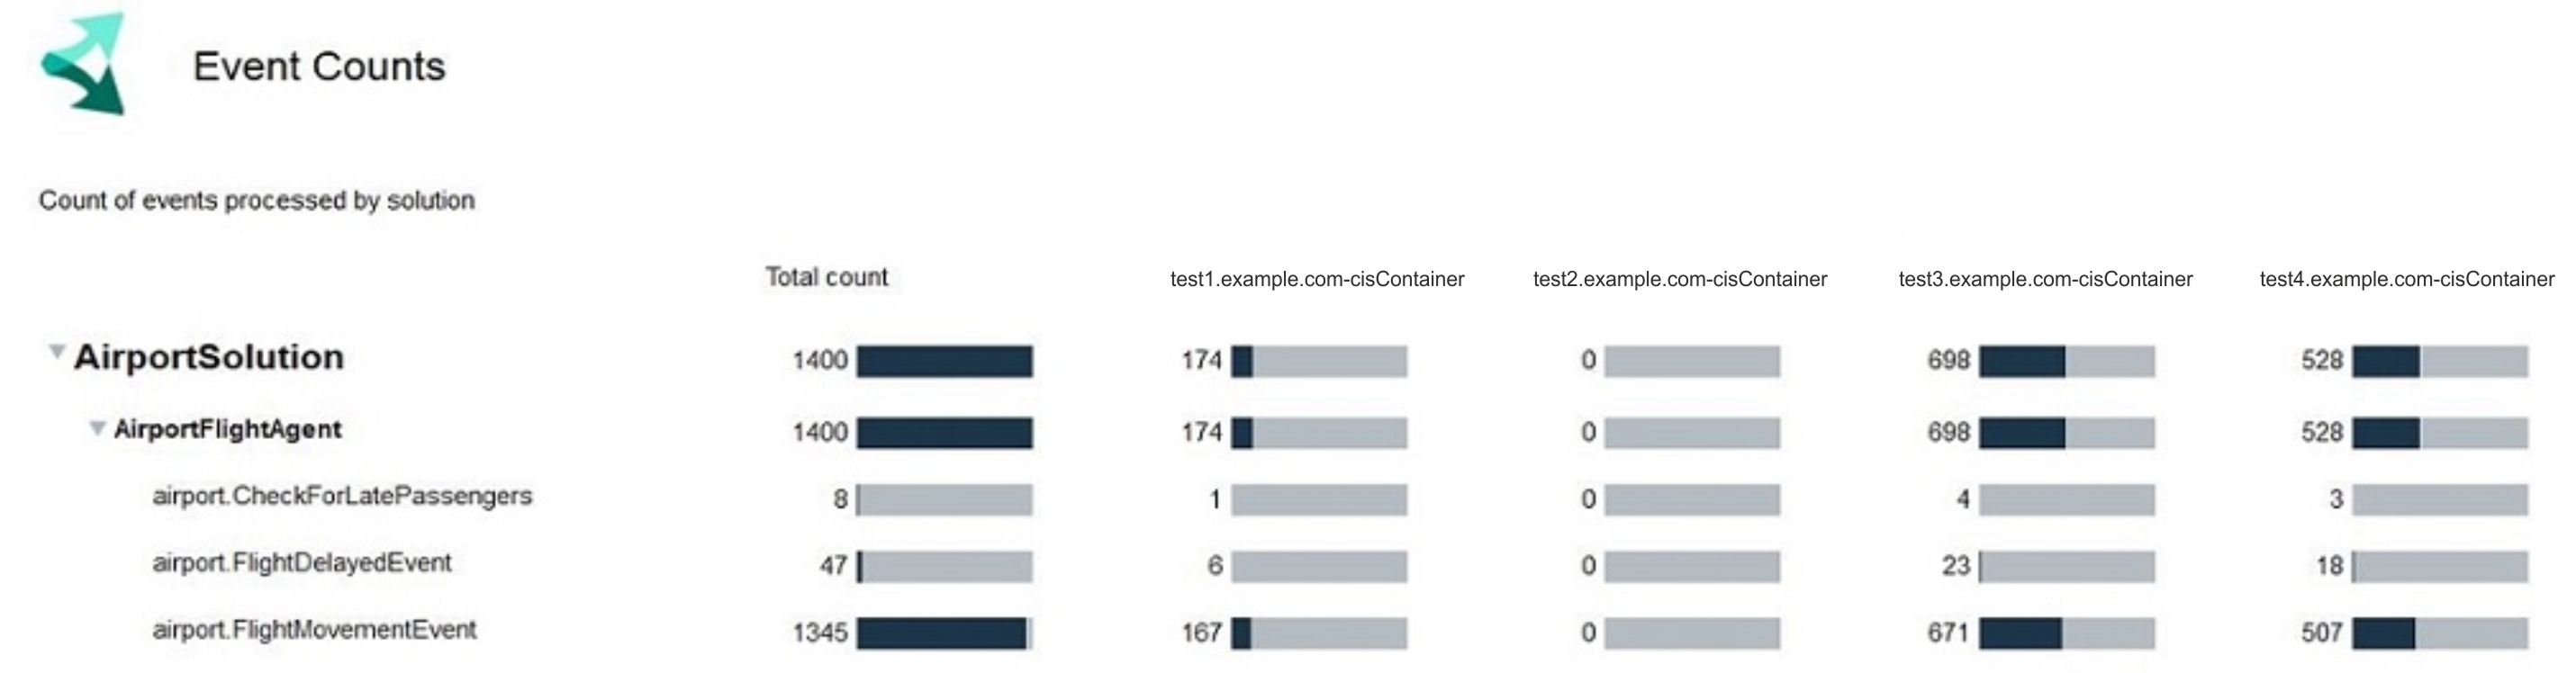
The following figure shows the Event Counts page. The
AirportSolution has a single rule agent that processed all of the event count for the solution, and
the majority of the events are processed by the second server. The event types are listed below the
agent name. The event type named airport.FlightMovementEvent shows 99% of the total event
count.
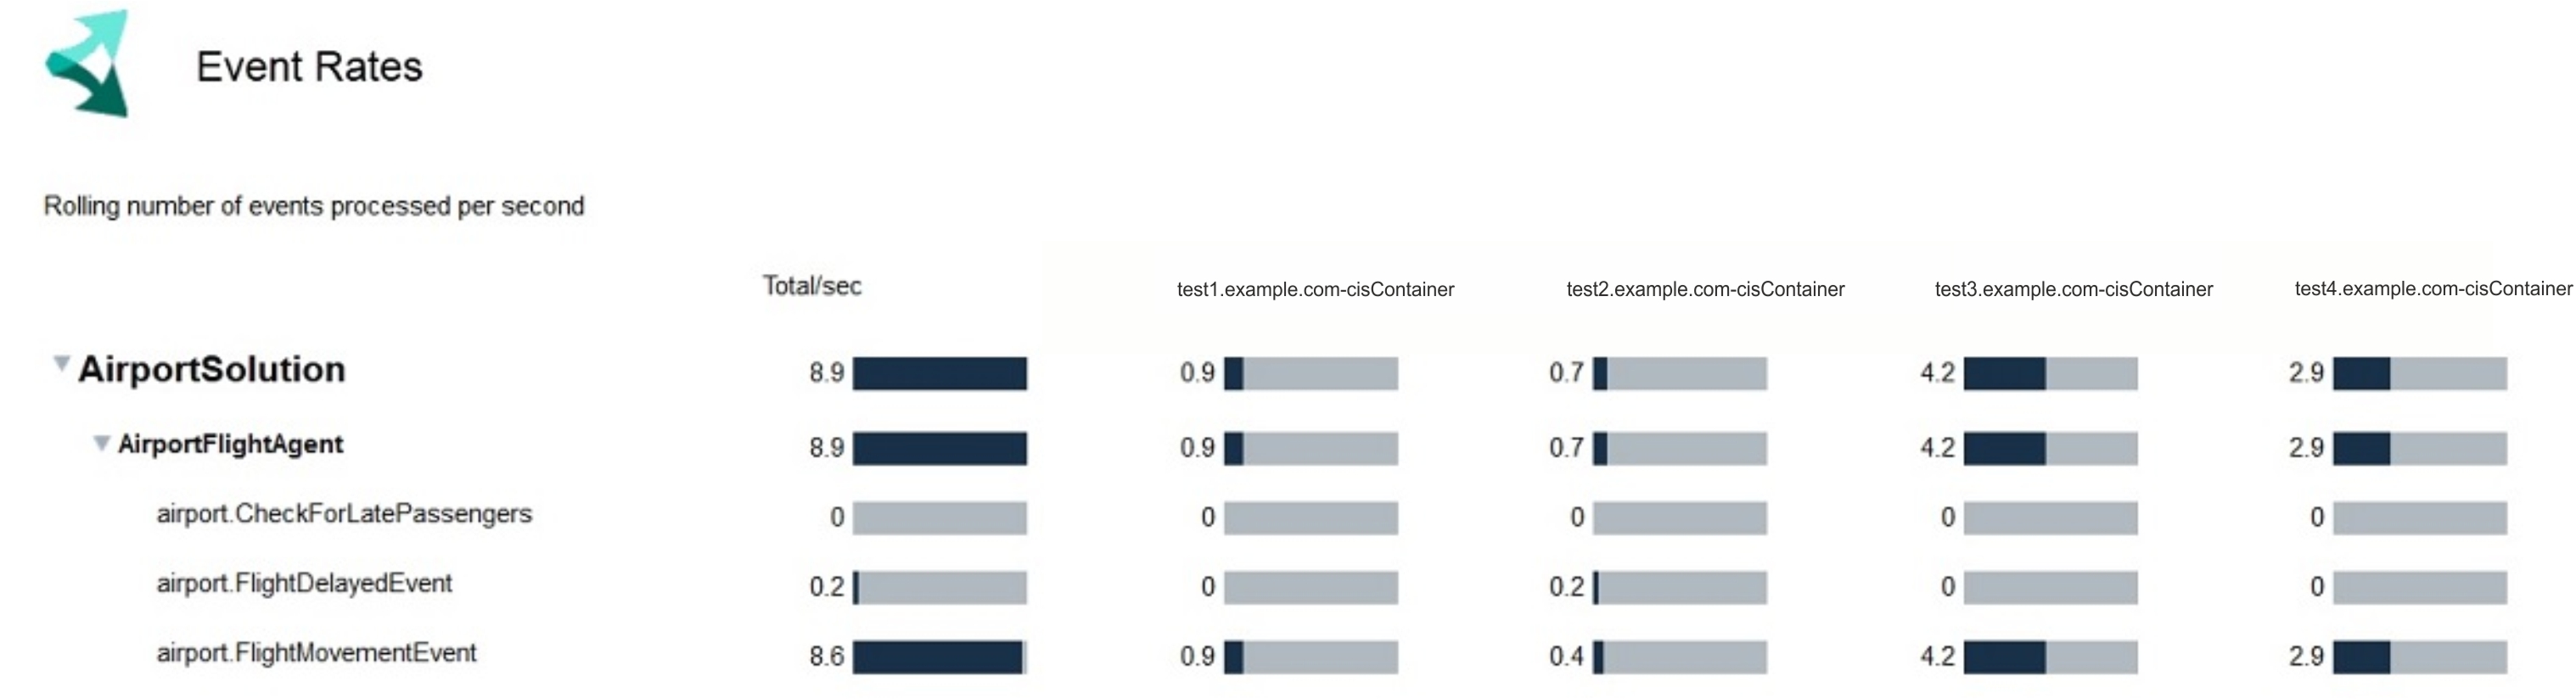
The following figure shows the Event Rates page. The event rates
vary across the servers and can be used to monitor the processing rate of events on each servers in
real-time.