You can run and rebuild this sample, and you can also look at source files to understand how this sample works.
Running this sample
Running the reports in Decision Center
To run the customized reports in Decision Center:
-
Sign in to Decision Center(http://localhost:<PORT>/teamserver) with the following username and password:
Username: rtsUser1
Password: rtsUser1
-
Switch to the loanvalidation-rules project.
-
Click the Analyze tab.
The Custom Reports section displays the list of available customized reports.
The Ruleflow Report provides detailed information on the content of a ruleflow.
To run the Ruleflow Report:
-
Click Ruleflow Report.
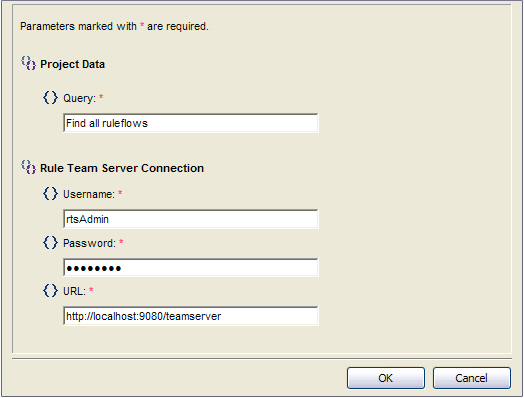
A new web page displays the Parameter dialog with the name of the query used to retrieve the ruleflow, and the username and password used for Decision Center. For more information, see Report parameters.
-
Click OK.
Decision Center displays the Ruleflow Report.
The Rule Expiration Report highlights the rules that have expired or that expire within 7, 30, or 90 days.
Before you run the report, create a new rule in Decision Center and set its Expiration Date to yesterday.
To run the Rule Expiration Report:
-
Click Rule Expiration Report.
A new web page displays the Parameter dialog with the name of the query used to retrieve the rules, and with the username and password used for Decision Center. For more information, see Report parameters.
-
In the Expiration field, specify whether you want to display the rules that expire within 7, 30, or 90 days.
-
Click OK.
Decision Center displays the Rule Expiration Report and shows the expired rule in red. You can click the name of the rule (permalink) to access it directly.
The Rule Life Cycle Report shows rules created, updated, and deleted within a certain date range.
To run the Rule Life Cycle Report:
-
Click Rule Life Cycle Report.
A new web page displays the Parameter dialog with the name of the query used to retrieve the rules, and with the username and password used for Decision Center. For more information, see Report parameters.
-
In the Range Date section, select the current date as End Date and leave the default value for the Start Date.
-
Scroll down in the Parameter dialog to access the Filters section.
-
In the Filters section, select all the available filters (Rules Created, Rules Updated, Rules Deleted).
Note:To select more than one filter, use Ctrl, and Ctrl + Shift.
-
Click OK.
Decision Center displays the Rule Life Cycle Report. The report displays rules created, updated, or deleted within the date range you specified. You can click the name of the rule (permalink) to access it directly.
The Status Report shows the status of your rules.
To run the Status Report:
-
Click Status Report.
A new web page displays the Parameter dialog with the name of the query used to retrieve the rules, and with the username and password used for Decision Center. For more information, see Report parameters.
-
In the Range Date section, select the current date as End Date and leave the default value for the Start Date.
-
Scroll down in the Parameter dialog to access the Filters section.
-
In the Filters section, select all the available filters (New, Defined, Validated, Rejected, Deployable).
-
Click OK.
Decision Center displays the Status Report. The report displays the rules with a New, Defined, Validated, Rejected, or Deployable status within the date range you specified. You can click the name of the rule (permalink) to access it directly.
Before you run the report, edit a rule in Decision Center , and change its status to New, Defined, Validated, Rejected, or Deployable.
The Updated Status Report shows which rules have been updated with a specific status within a specified date range.
To run the Updated Status Report:
-
Click Updated Status Report.
A new web page displays the Parameter dialog with the name of the query used to retrieve the rules, and with the username and password used for Decision Center. For more information, see Report parameters.
-
In the Range Date section, select the current date as End Date and leave the default value for the Start Date.
-
Scroll down in the Parameter dialog to access the Filters section.
-
In the Filters section, select all the available filters (Rules with status changed to New, Defined, Validated, Rejected, and Deployable).
-
Click OK.
Decision Center displays the Updated Status Report. The report displays the rules that have had their status changed to New, Defined, Validated, Rejected, or Deployable within the date range you specified. You can click the name of the rule (permalink) to access it directly.
The Status Checkpoint Report shows the rules that have had a specific status since a specified date.
To run the Status Checkpoint Report:
-
Click Status Checkpoint Report.
A new web page displays the Parameter dialog with the name of the query used to retrieve the rules, and with the username and password used for Decision Center. For more information, see Report parameters.
-
In the Range Date section, select the current date as Start Date.
-
Scroll down in the Parameter dialog to access the Filters section.
-
In the Filters section, select all the available filters (Rule Status New, Defined, Validated, Rejected, and Deployable).
-
Click OK.
Decision Center displays the Status Checkpoint Report. The report displays the rules that have had a status New, Defined, Validated, Rejected, or Deployable since the date you specified. You can click the name of the rule (permalink) to access it directly.
You can also run the reports in Rule Designer although the information is retrieved from Decision Center.
Running the reports in Rule Designer
To run the report in Rule Designer:
-
Start Rule Designer
-
Select the same workspace as before: <InstallDir>/teamserver/samples/servercustomreport/workspace.
-
Make sure you are in the Report Design perspective.
There are four report templates available in the servercustomreport project:
-
ruleflow.rptdesign
rule_expiration.rptdesign
-
rule_lifecycle.rptdesign
You use the rule_lifecycle.rptdesign report template to run three reports: the Rule Life Cycle Report, the Status Report, and the Updated Status Report.
The Parameter dialog that opens when you run the rule_lifecycle.rptdesign report template contains the filters for these three reports.
-
rule_statuscheckpoint.rptdesign
The following procedures describe how to run each report.
When running the following reports, make sure that the URL in the Parameters dialog, contains the correct port number, and change it if necessary.
The Ruleflow Report provides detailed information on the content of the ruleflow.
To run the Ruleflow Report:
-
In the Report Design perspective, in the Navigator, right-click the servercustomreport project, and click Refresh.
-
Delete any existing .rptconfig file from the project.
-
Double-click the ruleflow.rptdesign report template.
The report template opens in the BIRT editor.
-
Click the Preview tab.
Rule Designer displays the Parameter dialog with the name of the query used to retrieve the ruleflow, and with the username and password used for Decision Center. Make sure that the URL contains the correct port for the sample server. For more information, see Report parameters.
-
Click OK.
Rule Designer displays the Ruleflow Report.
The Rule Expiration Report highlights the rules are expired or that expire within 7, 30, or 90 days.
If you have already created a new rule and set its Expiration Date to yesterday when you run the report in the Decision Center, you do not have to create a new one.
To run the Rule Expiration Report:
-
In the Navigator, right-click the servercustomreport project, and click Refresh.
-
Delete any existing .rptconfig file from the project.
-
Double-click the rule_expiration.rptdesign report template.
The report template opens in the BIRT editor.
-
Click the Preview tab.
Rule Designer displays the Parameter dialog with the name of the query used to retrieve the rules, and with the username and password used for Decision Center. Make sure that the URL contains the correct port for the sample server. For more information, see Report parameters.
-
In the Expiration field, specify whether you want to display the rules that expire within 7, 30, or 90 days.
-
Click OK.
The Rule Expiration Report opens and shows the expired rule in red. You can click the name of the rule (permalink) to access it directly in Decision Center.
The Rule Life Cycle Report shows rules created, updated, and deleted within a certain date range.
To run the Rule Life Cycle Report:
-
In the Navigator, right-click the servercustomreport project, and click Refresh.
-
Delete any existing .rptconfig file from the project.
-
Double-click the rule_lifecycle.rptdesign report template.
The report template opens in the BIRT editor.
-
Click the Preview tab.
Rule Designer displays the Parameter dialog with the name of the query used to retrieve the rules, and with the username and password used for Decision Center. Make sure that the URL contains the correct port for the sample server. For more information, see Report parameters.
-
In the Date Range section, select the current date as End Date and for the purposes of this sample, leave the default value for the Start Date.
-
Scroll down in the Parameter dialog to access the Filters section.
-
In the Filters list, select the following filters:
-
Rule Created
-
Rule Updated
-
Rule Deleted
-
-
Click OK.
The Rule Life Cycle Report displays rules created, updated, or deleted within the date range you specified. You can click the name of the rule (permalink) to access it directly.
The Status Report shows the status of your rules.
To run the Status Report:
-
In the Navigator, right-click the servercustomreport project, and click Refresh.
-
Delete any existing .rptconfig file from the project.
-
Double-click the rule_lifecycle.rptdesign report template.
The report template opens in the BIRT editor.
-
Click the Preview tab.
Rule Designer displays the Parameter dialog with the name of the query used to retrieve the rules, and with the username and password used for Decision Center. Make sure that the URL contains the correct port for the sample server. For more information, see Report parameters.
-
In the Date Range section, select the current date as End Date and leave the default value for the Start Date.
-
Scroll down in the Parameter dialog to access the Filters section.
-
In the Filters list, select the following filters:
-
Rules with status 'New'
-
Rules with status 'Defined'
-
Rules with status 'Validated'
-
Rules with status 'Rejected'
-
Rules with status 'Deployable'
-
-
Click OK.
The Status Report displays the rules that have a New, Defined, Validated, Rejected, or Deployable status within the date range you specified. You can click the name of the rule (permalink) to access it directly.
The Updated Status Report shows which rules are updated with a specific status within a specified date range.
Before running the report, edit a rule, and change its status to New, Defined, Validated, Rejected, or Deployable.
To run the Updated Status Report:
-
In the Navigator, right-click the servercustomreport project, and click Refresh.
-
Delete any existing .rptconfig file from the project.
-
Double-click the rule_lifecycle.rptdesign report template.
The report template opens in the BIRT editor.
-
Click the Preview tab.
Rule Designer displays the Parameter dialog with the name of the query used to retrieve the rules, and with the username and password used for Decision Center. Make sure that the URL contains the correct port for the sample server. For more information, see Report parameters.
-
In the Date Range section, select the current date as End Date and the default value for the Start Date.
-
Scroll down in the Parameter dialog to access the Filters section.
-
In the Filters list, select the following filters:
-
Rules with status changed to 'New'
-
Rules with status changed to 'Defined'
-
Rules with status changed to 'Validated'
-
Rules with status changed to 'Rejected'
-
Rules with status changed to 'Deployable'
-
-
Click OK.
The Updated Status Report displays the rules that have had their status changed to New, Defined, Validated, Rejected, or Deployable within the date range you specified. You can click the name of the rule (permalink) to access it directly.
The Status Checkpoint Report shows the rules that have had a specific status since a specified date.
To run the Status Checkpoint Report:
-
In the Navigator, right-click the servercustomreport project, and click Refresh.
-
Delete any existing .rptconfig file from the project.
-
Double-click the rule_statuscheckpoint.rptdesign report template.
The report template opens in the BIRT editor.
-
Click the Preview tab.
Rule Designer displays the Parameter dialog with the name of the query used to retrieve the rules, and with the username and password used for Decision Center. Make sure that the URL contains the correct port for the sample server. For more information, see Report parameters.
-
In the Date Range section, select the current date as Start Date.
-
Scroll down in the Parameter dialog to access the Filters section.
-
In the Filters section, select all the available filters (Rule status New, Defined, Validated, Rejected, and Deployable.).
-
Click OK.
The Status Checkpoint Report displays the rules that have had a status New, Defined, Validated, Rejected, or Deployable since the date you specified. You can click the name of the rule (permalink) to access it directly.
You can modify a report in Rule Designer and redeploy the customized report to Decision Center. See Modifying a report in Rule Designer .
Before you start, make sure you are working in the Report Design perspective, and that the sample server is running, see Starting and stopping the sample server.
The following example illustrates how to customize the report to highlight the expiration date of an expired rule. To modify the Rule Expiration Report in Rule Designer:
Modifying a report in Rule Designer
-
Double-click the rule_expiration.rptdesign report template.
The report template opens in the BIRT editor.
-
In the Layout tab of the report template, select the [expiration date] element.
-
In the Property Editor, click the Highlights tab.
-
Click Add.
Rule Designer displays the New Highlight dialog.
-
In the Condition section, enter the following values:
-
Select expirationdate, and then change row["expirationdate"] to row["expired"].
-
Select Equal to.
-
Enter true.
-
-
In the Format section, set the formatting to red and bold.
-
Click OK, and then click Save.
-
Click the Preview tab, and wait for the report to display.
Rule Designer displays the expiration date of the expired rule in red and bold.
Repackaging the Web application
After you have modified your report, you redeploy it to the customized BIRT web application.
To redeploy the report to the BIRT Web application:
-
In the Samples Commands view, navigate to .
-
Execute the run command to package the Web application.
- Wait until the Console shows that the build is successful.
Testing the report in Decision Center
You can now test the customized report in Decision Center.
Make sure that the sample server is still running. For more information about starting the sample server, see Starting and stopping the sample server.
To test the report in Decision Center:
Sign in to Decision Center.
Click the Analyze tab.
Click the Rule Expiration Report link.
The Parameter dialog is displayed, with the name of the query used to retrieve the rules, and with the username and password.
In the Expiration field, specify whether you want to display the rules that expire within 7, 30, or 90 days.
The Parameter dialog is displayed, with the name of the query used to retrieve the rules, and with the username and password.
- Click OK, and wait for the report to display. The expiration date of the expired rule is displayed in red and bold.
Rebuilding this sample
To rebuild this sample:
-
In the Samples Commands view, navigate to .
-
Execute the run command to rebuild the sample and deploy the .ear files.
How this sample works
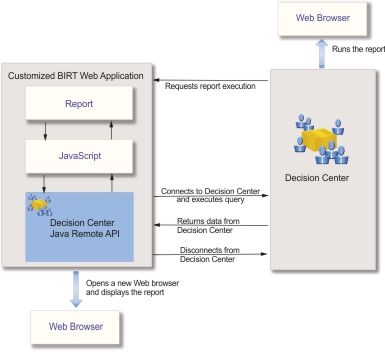
The following figure illustrates integration in Decision Center:
| |
BIRT Web Application: report\*.rptdesign, script\*.js, L10N\*.properties files |
| |
BIRT Web Application: WEB-INF\lib directory |
The Decision Center Java™ Remote API is deployed within the BIRT web application.
A report execution request is activated when you click a link on the Analyze tab. This link points to the customized BIRT application. The http report execution request contains the values of the hidden parameters required to execute the report.
The report uses JavaScript data sets that rely on the Java Remote API of Decision Center and connects to Decision Center to collect the data required to populate the report.
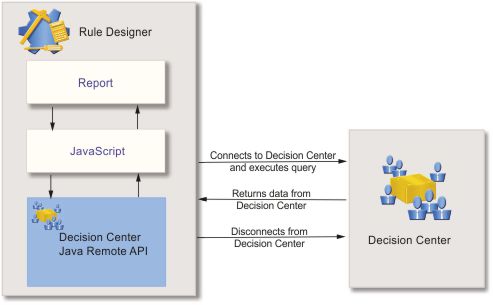
You can run and customize the reports in Rule Designer, however the data used in the reports is retrieved from Decision Center. The following figure illustrates integration in Rule Designer:
| |
Project artifact: *.rptdesign and *.js files |
| |
BIRT plug-in directory: \birt\WEB-INF\lib directory |
The Decision Center Remote Java API is deployed in the BIRT Eclipse plug-in. The report uses JavaScript data sets that rely on the Decision Center Java Remote API.
The servercustomreport sample consists of two projects:
Sample packaging
-
A web application project: <InstallDir>/teamserver/samples/servercustomreport.
You use this project to perform the following tasks:
-
Update the Analyze tab in Decision Center to display the list of available reports.
-
Package and deploy the BIRT web application, to add the reports and the necessary files from the Rule Designer BIRT project to the web application.
-
-
A BIRT project: <InstallDir>/studio/samples/brmanagement/servercustomreport/servercustomreport.
This project contains the report, JavaScript, and properties files.
You use this project to perform the following tasks:
-
Run the reports directly from Rule Designer.
The data displayed in the reports is retrieved from Decision Center. Make sure Decision Center is running.
-
Customize the report templates.
-
The sample packaging is as follows:
| File | Description | Rule Designer project directory | BIRT project directory |
|---|---|---|---|
| *.rptdesign | Report files | <InstallDir>/studio/samples/brmanagement/servercustomreport | /report |
| *.js | JavaScript files | <InstallDir>/studio/samples/brmanagement/servercustomreport/servercustomreport/scriptlib | /scriptlib |
| *.*_en_US.properties | L10N files | <InstallDir>/studio/samples/brmanagement/servercustomreport/servercustomreport/L10N | /L10N |
| samplereport.properties | Configuration file | WEB-INF/lib/sample.jar |
The Analyze tab is updated with a new Custom Reports section that displays the list of the new available reports:
Updating the Analyze tab
-
Ruleflow Report
-
Rule Expiration Report
-
Rule Life Cycle Report
-
Status Report
-
Updated Status Report
-
Rule Status Checkpoint
The sample uses the following files to update the Analyze tab with the new reports:
-
A JSF bean (SampleReportManager) delivers the list of available reports and their description. The JSF bean is declared in <InstallDir>/teamserver/samples/servercustomreport/WebContent/WEB-INF/extended-faces-config.xml.
-
The page displayed is located in <InstallDir>/teamserver/samples/servercustomreport/WebContent/custom/analyze.jsp.
You use report parameters to filter the data in reports. When a report contains declared parameters:
Report parameters
-
The Parameter dialog opens before the report generation
-
The parameter values display from JavaScript data sets in the Parameter dialog.
You use these parameter values later in the report scripts.
The Parameter dialog prompts you to enter your Decision Center username and password. When you do so and click OK, the values are sent across the network in clear text. To prevent this from happening:
-
Deploy the customized BIRT web application in your application server so that access is through an HTTPS port. For more information, refer to your application server guide.
-
Modify the servercustomreport/resources/samplereport.properties file by updating the following key: sample.birt.url=https://HOSTNAME:XXXX/rtsbirt/preview? where HOSTNAME is the name of the host and XXXX is the https port.
Use the following parameters to complete the Parameter dialog.
| Data set | Purpose |
|---|---|
| ParameterRangeDateDataSet | This data set provides the startDate and endDate parameter values. |
| ParameterProjectDataDataSet | This data set provides the project, baseline, and query parameter values. |
| ParameterRTSConnectivityDataSet | This data set provides the datasourceand url parameter values. |
| ParameterFiltersDataSet | This data set provides the filters parameters, such as Rules Created, Rules with status 'New', and Rules with status changed to 'Defined'. |
The following table lists the filters used by the rule_lifecycle.rptdesign and rule_statuscheckpoint.rptdesign report templates:
Each time you create, update, delete, or restore a rule, a rule version is stored in the Decision Center database. Each version is identified by a version number with the following format versionMajor.versionMinor (for example, 1.1).
| Report template | Filter label | Description | JavaScript class |
|---|---|---|---|
| rule_lifecycle.rptdesign | Rules Created | This filter selects the rule if version 1.0 is created between the startDate and endDate parameters | CreatedFilter() |
| Rules Deleted | This filter selects the rule if there is at least one version considered as deleted between the startDate and endDate parameters | DeletedFilter () | |
| Rules Updated | This filter selects the rule if there is at least one version considered as an update (that is, version 1.0 is excluded as well as the deleted versions) between the startDate and endDate parameters | UpdatedFilter () | |
| Rules with status 'New', 'Defined', 'Validated', 'Rejected', or 'Deployable' | This filter selects the rule if there is at least one version of the rule with the status 'New', 'Defined', 'Validated', 'Rejected', or 'Deployable', and if the version date is between the startDate and endDate parameters | StatusFilter() | |
| Rules with status changed to any value, 'New', 'Defined', 'Validated', 'Rejected', 'Deployable' | This filter selects the rule if there is at least one version of the rule with the status changed and if the version date is between the startDate and endDate parameters | UpdatedStatusFilter() | |
| rule_statuscheckpoint.rptdesign | Rule with status 'New', 'Defined', 'Validated', 'Rejected', or 'Deployable' | This filter selects the rule if it has the status set to 'New', 'Defined', 'Validated', 'Rejected', or 'Deployable' at least since the startDate | StatusSinceFilter() |
The Parameter dialog contains several parameters, some of which are hidden:
-
A project name (hidden)
-
A baseline (hidden)
-
A query to retrieve the rule artifact (rule or ruleflow)
-
The URL of Decision Center (hidden) and its associated datasource (hidden)
-
The Decision Center username
-
The Decision Center password
To keep this sample as simple as possible, the values are not validated. If you select the wrong values you might get errors when executing the report.
To select more than one filter in the Parameter dialog, use Ctrl, and Ctrl + Shift.
The Parameter dialog displayed when executing the report in Decision Center is customized. You can modify the webcontent/birt/styles/dialogbase.css file to customize it yourself.
The data sets and data sources rely on JavaScript code that uses the Remote Java API of Decision Center.
All the reports use the RTSRepository JavaScript class to connect to Decision Center and execute queries.
| Key JavaScript file | Purpose |
|---|---|
| Repository.js | This file connects to Decision Center and executes the query in Decision Center. |
| Datasource.js | This file maintains the session to Decision Center. |
| ModelHelper.js | This file handles the Decision Center object model by calling the Java API. |
All the data sets are parameterized, except the first data set executed for a report.
To access the list of parameters for a specific data set:
-
Right-click the data set in the Outline view and select Edit.
-
In the Edit Data Set dialog, select Parameters.
In the report template, to view the value assigned to the parameter, right-click the List or Table elements (use the Outline view to easily locate them), and then click Edit Data Binding.
Source files
This sample is composed of two projects:
-
The servercustomreport BIRT project is located in <InstallDir>studio/samples/brmanagement/servercustomreport.
This project contains the reports and their associated JavaScript classes.
The following table lists the key source files and directories used in this sample and how to use them.
File/directory Description ruleflow.rptdesign The ruleflow BIRT report file rule_expiration.rptdesign The rule expiration BIRT report file rule_lifecycle.rptdesign The rule life cycle BIRT report file rule_statuscheckpoint.rptdesign The rule checkpoint BIRT report file L10N/ The BIRT report message properties files scriptlib/ The JavaScript classes managing the data sets -
The servercustomreport web application project is located in <InstallDir>teamserver/samples/servercustomreport.
File/directory Description resources/messages.properties The localized message file for the user interface resources/samplereport.properties The list of available reports in the sample along with technical properties src/ilog/rules/sample/rts/Configuration.java The class responsible for loading the samplereport.properties file src/ilog/rules/sample/rts/Report.java The class that represents a report src/ilog/rules/sample/rts/ReportManager.java The class that manages all the reports in the sample WebContent/custom/analysze.jsp The customized JSP file WebContent/WEB-INF/extended-faces-config.xml The JSF configuration file
You can also view and modify the sample source files in Rule Designer. To import the sample into your workspace, click the Import projects link in the Samples and Tutorials view.