Viewing resource statistics data
You can view resource statistics by using the Resource Statistics tab in the web user interface, or you can display them in a Kibana dashboard in IBM® Cloud. You can also view them in files if you have specified that they are to be written to the file system.
Before you begin
- Read the concept topic, Resource statistics.
- Start resource statistics collection; see Managing resource statistics collection
About this task
This topic describes how to view resource statistics for your integration servers by using the Resource Statistics tab in the web user interface. For information about resource statistics that are written to files, see Reporting resource statistics to files.
You can also view resource statistics collection by subscribing to the topic on which statistics are published. For more information, see Subscribing to event message topics.
To view resource statistics in the web user interface, complete the following steps:
Procedure
- Start the web user interface for your integration node,
as described in Accessing the web user interface.
The navigator is displayed on the left side of the pane, showing the servers (integration servers), message flows, and other resources that are owned by your integration node.
- Expand the Servers section in the navigator.
- Click the integration server for which you want to view
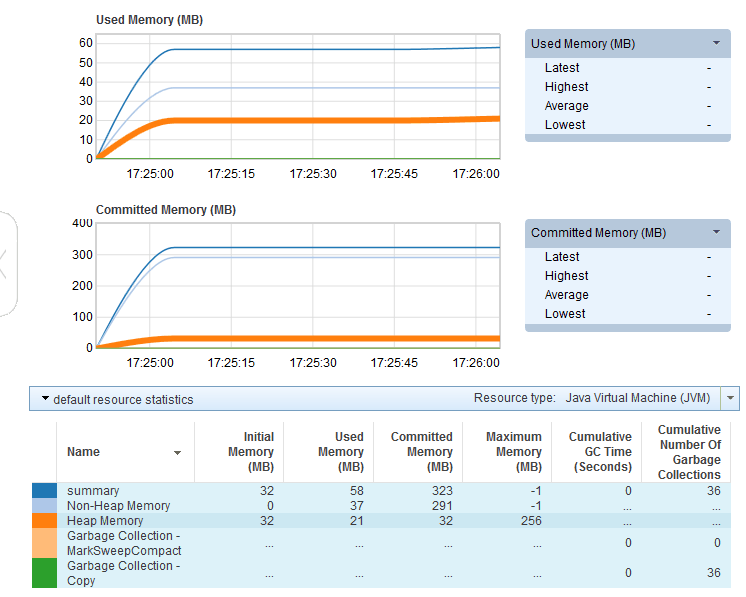
resource statistics. A tab that is named Resource Statistics is displayed. The data is displayed in three graphs and one table and is updated every 20 seconds. The data for Java™ Virtual Machine (JVM) is displayed by default.
- Optional: If you want to view the statistics
for a different resource, click the down arrow beside Resource
Name on the table to display the menu, and select
the required resource. The statistics that are associated with this resource are then displayed in the table and graphs.
The table consists of a row for each subcategory of the selected statistic and a number of columns, one for each measurement; some statistics have only a summary row. For example, as shown in the following image, if you select Java Virtual Machine (JVM), the table includes rows for heap and non-heap memory and columns for initial, used, committed, and maximum memory, in addition to the summary row.

By default, the three graphs display the data from the first three columns of the summary row. If the table contains more than one statistic, you can click on a statistic name in the table to add it to the graph. Different colors are used to distinguish the statistics on the graph. Also, if you hover over a statistic name in the table, the associated line in the graph is highlighted, as shown in the following image.

You can display the data from different columns of the table by clicking the arrow beside a graph and selecting a column name from the menu, as shown in the following image.

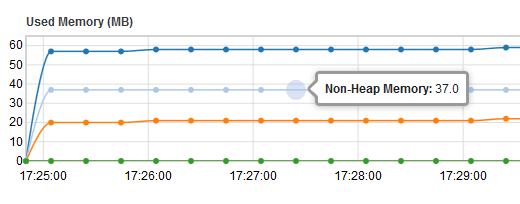
You can change the time period that is covered by the graph by clicking the arrow next to Time range in the graph header and selecting the time period that you want to view. For example, to see the resource statistics that were collected in the last hour, select 60 mins. To see all the resource statistics that were collected since resource statistic collection started, select Session. If you hover over a graph, you can see the collection points. If you hover over a collection point, you can see the value of the measurement that was collected at that time, as shown in the following image.

If you have selected a single statistic in the table, the most recent, highest, lowest, and average values of the measurement in the selected column, over the selected time period are displayed beside the graph
You can download the statistics data for the selected resource in .csv format by clicking the Download icon.
What to do next
- JVM statistics
-
- How much memory is the JVM using?
-
Many tools that are specific to an operating system give you the total memory that is used by the integration server, but they do not show you how that memory is divided between Java processing and other processing in the integration server. By looking at the field
CommittedMemoryInMB, you can see how much memory is currently allocated to the JVM. Then look at the fieldMaxMemoryInMBto see the maximum amount of memory that can be allocated. - How often is garbage collection done? Is it affecting the performance of the integration server?
-
To see how often the JVM is doing garbage collection, check the
CumulativeNumberOfGCCollectionsfield to see if the rate of collections is increasing. Garbage collection is a normal process, and is therefore expected to some degree. However, excessive garbage collection can affect performance.To see whether current garbage collection is excessive, monitor the
CumulativeGCTimeInSecondsvalue. If this value is increasing by more than 2 seconds in each 20-second statistics interval, try increasing the JVM maximum heap size for your integration server by using the mqsichangeproperties command. You might also want to inspect all the Java user-defined nodes and JavaCompute nodes that are included in your deployed message flows, to ensure that they do not create and delete many objects that could be reused; frequent deletions can contribute to excessive garbage collection. - Do I need to change the minimum or maximum heap sizes?
-
- If the
CumulativeGCTimeInSecondsvalue is increasing by more than 2 seconds in each 20-second statistics interval, increase the maximum heap size to reduce this increase. - If the
UsedMemoryInMBvalue is never close to theInitialMemoryInMBvalue, you might have allocated more memory for the heap than is required. Therefore, reduce the JVM minimum heap size value for the integration server to a value that is closer to theUsedMemoryInMBvalue.
Change these values gradually, and check the results to find the optimum settings for your environment.
- If the
- Parsers
-
- Are message parsers using more memory than expected?
-
A message flow parses input messages and can create many output messages. These messages might have large bit streams or large message trees. The parsers created to perform this message processing might use a large amount of memory. Use the Parsers statistics to determine whether message flow parsers are using more memory than expected. If so, consider deploying such flows into separate integration servers or improving ESQL or Java plug-in API processing to efficiently handle large messages or transformations.
- Is message parsing or writing failing frequently for a particular message flow?
-
If a message flow receives or attempts to write an invalid message, it is likely that this will be rejected by a parser. Use the message parsers statistics to see whether a message flow is rejecting a large amount of input or output messages compared with successful processing.
- Outbound sockets
-
- Are the nodes reusing outbound sockets?
-
Creating outbound sockets can be an expensive operation, and the number of sockets available on a computer is a finite resource. Therefore, increasing socket reuse can enhance performance. If the workload is continuous and consistent, the
TotalSocketsvalue indicates an initial period of activity, which then reduces when the integration server starts to reuse sockets.A steady increase in the
TotalSocketsvalue over time is expected because sockets are closed after a period of inactivity, or when they have been used many times.If the
TotalSocketsvalue increases significantly over time, this trend might indicate that outbound sockets are not being reused.If your message flows include HTTPRequest nodes, check that you have set the keepalive property Enable HTTP/1.1 keepalive.
Check also whether the endpoint that is called uses keepalive sockets.
- Which endpoints are most used?
-
The values
TotalMessagesindicates how busy each endpoint is. The value in the summary record tells you how much activity occurred across the whole integration server. - How large are sent and received messages?
-
The values of the
SentMessageSize_*andReceivedMessageSize_*fields give a profile of the message sizes that flow to and from each endpoint.
- JDBC connection pools
-
- Do I need to change the size of the connection pool?
-
If the statistics show that the count of callers that are waiting for connections is high, and the wait time is increasing, consider increasing the size of the pool by using the
MaxConnectionPoolSizeproperty for the JDBCProvider configurable service.Alternatively, try reducing the number of additional instances that are configured for the message flow.
- TCPIPClientNodes
-
- Are the nodes reusing outbound sockets?
-
Creating outbound sockets can be an expensive operation, and the number of sockets available on a computer is a finite resource. Therefore, increasing socket reuse can enhance performance. If the workload is continuous and consistent, the
TotalSocketsvalue indicates an initial period of activity, which then reduces when the integration server starts to reuse sockets.A steady increase in the
TotalSocketsvalue over time is expected because sockets are closed after a period of inactivity, or when they have been used many times.If the
TotalSocketsvalue increases significantly over time, this trend might indicate that outbound sockets are not being reused.If your message flows include HTTPRequest nodes, check that you have set the keepalive property Enable HTTP/1.1 keepalive.
Check also whether the endpoint that is called uses keepalive sockets.
- How does the information that I see in the web user interface relate to my TCP/IP flows?
- An entry is displayed for each configurable service, not for each flow.