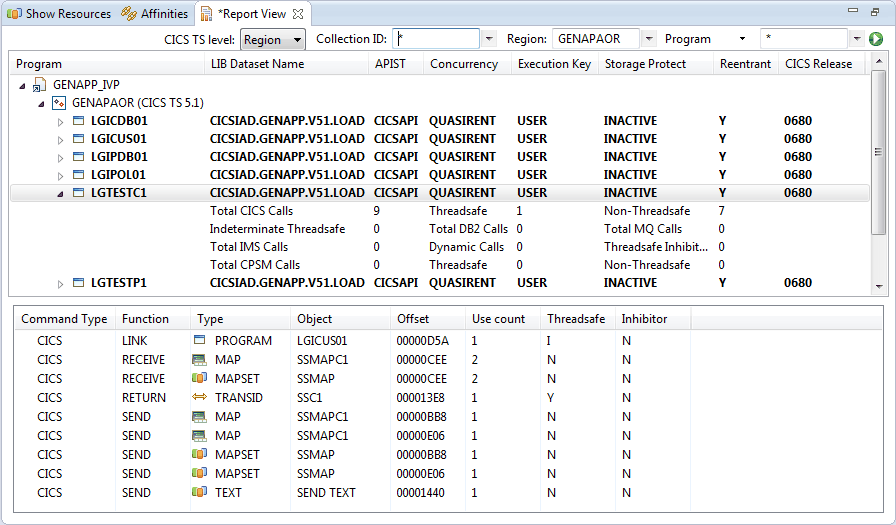
Report view
Use the Report view to view or create summary or detailed reports of threadsafe issues in HTML format.
For information about creating threadsafe reports, see Creating a report of threadsafe issues.
For information about creating and viewing affinity reports, see Creating an affinity report.
- A toolbar with fields where you can enter criteria to defines the scope of the threadsafe report
- Program summary section
- Program details section

To save the report, click the Save button in the toolbar of the perspective, or click on the main menu. You are prompted to select a folder and enter a file name. To save the detailed information, select Save detailed information. Only the detailed information for the program you select is saved; if you do not select a program in the upper section, the details for the lower table are not saved. The saved report is listed in the Report Explorer view.
You can view the saved report in the Report Browser view.
Toolbar
- CICS TS level. Report on only the commands that are available in the specified CICS® TS release.
- Collection ID. Report on programs that were collected with the specified collection ID. You can use an asterisk character (*) as a wildcard.
- Region. Report on programs that were collected in the specified CICS regions. You can use an asterisk character (*) as a wildcard. If you set the CICS TS level in this field, the report displays the threadsafe information for programs in regions that are at that CICS release.
- Program or Transaction.
Report on the data that was collected for the named programs or transactions.
You can use an asterisk character (*) as a wildcard. To change this
field between Transaction and Program,
click the icon
 after the field name.
- Previous search icon
 . Show any previous search values for the relevant field.
 - Create Report icon
 . Submit
this request and display the program summary information in the upper
section of the Report view.
Program summary
The upper section of the Report view displays the program summary information. The programs are grouped by the collection IDs and regions. You can expand the tree structure to display the programs and statistics for threadsafe, non threadsafe, and other calls issued by each program. To show program details, click the program name.In the Reentrant column, Y indicates that the program is reentrant, a blank indicates that the program is not reentrant, and ? indicates that the reentrant status is not known.