This example shows you how to create a dashboard and how
it functions in Process Portal.
About this task
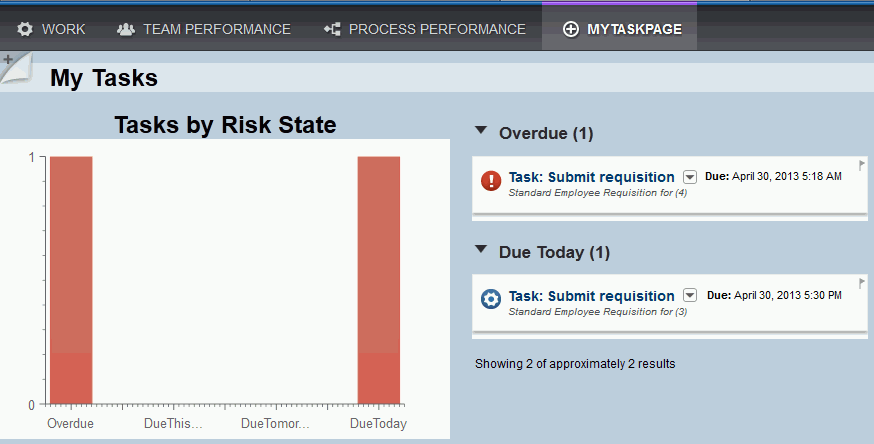
The dashboard in this example contains a task list and
a chart. The task list shows the currently active tasks. The chart
shows the number of these tasks and their current states.
Procedure
- In your process application, add a dependency to the Dashboards
8.5.0 toolkit. For information about adding a dependency
to a toolkit, see Creating, changing, and deleting a toolkit dependency in the Designer view.
- Create a human service called MyTaskPage. For information, see Building a heritage human service.
- In the Variables page of MyTaskPage,
add the following private variables:
| Variable name |
Type (location of the type) |
|---|
| chartdata |
ChartData (Dashboards 8.5.0) |
| tasklistdata |
TaskListData (Dashboards 8.5.0) |
| chartdisplayoptions |
ChartDisplayOptions (Dashboards
8.5.0) |
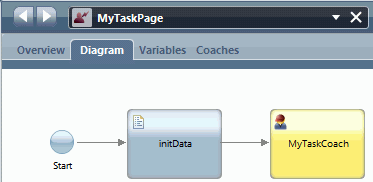
- In the MyTaskPage diagram, add a server script and a Coach
to the layout. Connect the start node to the script and the script
to the Coach.
- Select the server script and add the following JavaScript
code in the implementation properties. This code initializes
the variables that the dashboard uses.
var tlProps = new tw.object.TaskListProperties();
tlProps.includeRiskStateSummary = true;

tw.local.chartdata = new tw.object.ChartData();
tw.local.chartdata.plots = new tw.object.listOf.ChartDataPlot();
tw.local.chartdata.plots[0] = new tw.object.ChartDataPlot();
tw.local.chartdata.plots[0].series = new tw.object.listOf.ChartDataSeries();
tw.local.chartdata.plots[0].series[0] = new tw.object.ChartDataSeries();
tw.local.chartdata.plots[0].series[0].label = "Task risk states for current user";
tw.local.chartdata.plots[0].series[0].data = new tw.object.listOf.ChartDataPoint();

var tld = tw.system.retrieveTaskList(tlProps, 0, 0);
tw.local.tasklistdata = tld;
var riskstatesKeys = tld.riskStateSummary.keyArray();
for (var i=riskstatesKeys.length;i--;) {
	var dataPoint = new tw.object.ChartDataPoint();
	dataPoint.name = tld.riskStateSummary.keyArray()[i];
	dataPoint.value = tld.riskStateSummary.valueArray()[i];
	tw.local.chartdata.plots[0].series[0].data.insertIntoList(0, dataPoint);
}

//Setting the configuration options for the chart by script instead of the UI
tw.local.chartdisplayoptions = new tw.object.ChartDisplayOptions();
tw.local.chartdisplayoptions.plots = new tw.object.listOf.ChartPlotDisplayOptions();
tw.local.chartdisplayoptions.plots[0] = new tw.object.ChartPlotDisplayOptions();
tw.local.chartdisplayoptions.plots[0].plotType = "Columns";
tw.local.chartdisplayoptions.plots[0].displayHorizontalAxis = true;
tw.local.chartdisplayoptions.plots[0].displayVerticalAxis = true;
Tip: If you see warning icons, check the spelling
of your variables.
- In the Coach, create the layout for the dashboard:
- In the palette filter, select Dashboards to
put the Dashboard controls onto the palette.
- Add a Custom HTML advanced item. In its properties,
paste the following code:
<style>
.DashboardTitle {
	background-color: rgb(222,231,239);
	text-indent: 50px;
	font-size: 24px;
}
</style>
The code indents the title so that it is not
overlapped by the feature that sets the landing page for Process Portal.
- To add the title to the dashboard, add an Output Text
control and set its label to My Tasks. Clear
its binding because the binding is not needed. In its HTML attributes,
add the DashboardTitle class. This class
is the class that you set the CSS rule for in the custom HTML.
- To contain the visual elements of the dashboard, add
a Horizontal Section control. In the general properties of the section,
set its label visibility to Hide.
- To add the task list to the dashboard, add a Task List
control that is bound to the tasklistdata private
variable to the horizontal section.
- To add the chart to the dashboard, add a Chart control
that is bound to the chartdata private variable to
the horizontal section.
- To set the look of the chart, configure the Chart control
by setting the following configuration properties:
| Configuration property |
Value |
|---|
| Title |
Tasks by Risk State |
| Width |
600 |
| Height |
300 |
| Theme |
At risk or overdue |
| Display options |
chartdisplayoptions variable |
- Add a Navigation Controller to the layout. The
Navigation Controller provides the navigation from the dashboard to
the Work page.
- Remove the OK button that the
Coach provided by default. The button is not required because
there is no other Coach to transition to.
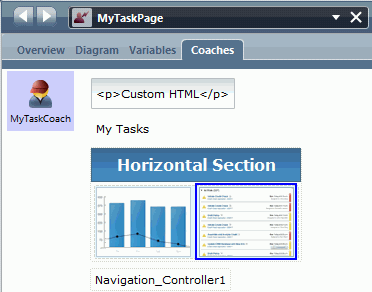
The layout for the Coach looks something like this screen capture:
- In the Overview page of the MyTaskPage
human service, set the exposure settings:
- For Exposed To, select the Approvers team.
- For Expose As, select Dashboard.
- Save your dashboard.
Results
When you log in to Process Portal, the
example dashboard is in the task list. When you select the example
dashboard you can then see its contents: the task list and chart.
The task list might contain tasks as shown in the following screen
capture:
If the task list does not contain tasks,
you can use the Hiring Sample to populate the task list if the sample
is available. In the
Work page, select
Standard
HR Open New Position. This action creates a submit requisition
task. Do not complete and submit the task because that action moves
the task to a different step in the task flow. If you return to the
MyTaskPage dashboard, the task list contains this task.
When
you select a task from the list, the Work page
opens to display the task details. If you do not complete the task
and return to the example dashboard, the task list still contains
the task. If you then select the new task, the Work page
shows the new task. When you return to the previous task, data that
was in the form when you clicked Next or Submit is
preserved.


