In Version 9.7, you can use a more comprehensive
set of time-based monitor elements to understand where and how the DB2® database manager spends its
time. With the ability
to pinpoint where most of the time is spent, you can locate potential
sources of problems more easily and determine whether tuning can be
done to improve performance.
The new time-spent monitor elements, including wait
times and component times, provide the following information:
- Total time spent processing requests and total wait time within
the DB2 database manager. Use
this to approximate system utilization; as well as how much time the
database manager spends working actively on requests versus waiting
on a resource.
- Detailed breakdown of wait times by resource (such as lock, buffer
pool, or logging). This breakdown allows you to identify the primary
contributors to wait time within the DB2 database
manager.
- Starting in DB2 Version
9.7 Fix Pack 1, detailed breakdown of processing time by component
(such as compilation, or section execution). This breakdown allows
you to identify the primary contributors to processing time within
the DB2 database manager.
- Measurement of time spent outside the DB2 database manager (client_idle_wait_time).
This allows you to identify whether a slowdown in performance is occurring
inside or outside the DB2 database
manager.
The time-spent monitor elements complement other time-based types
of monitor elements, such as CPU time (the amount of CPU used) provided
by the operating system, and monitor elements that approximate overall
application response time provided by the DB2 database manager.
Example
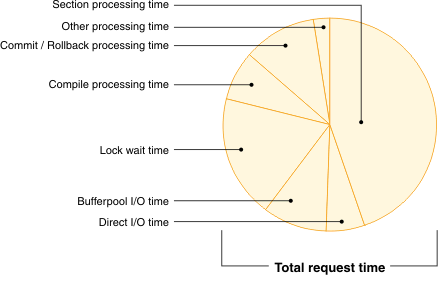
The following diagram shows one
possible visualization of the total DB2 request
time on a particular system:

In this example, the section processing time
is responsible for a significant percentage of the total request time.
This is generally desirable because section processing time represents
the time that is spent doing core SQL processing rather than waiting
on resources or driving transaction end processing. On the other hand,
a large percentage of the overall request time is also spent in various
waiting situations; lock wait time specifically. This percentage of
lock wait time is undesirable and indicates the need to investigate
the locking behavior in more detail.
