You can use the DB2® workload management tools to help design, monitor, and tune a workload management configuration even if you do not have capacity analysis data to use for designing the configuration.
Assume that you do not initially know which workloads and service classes to create because either you do not have full knowledge of the workload on the system or you do not yet know which workloads are required for stable execution results. Also assume that you know that some applications have response time requirements but that you do not yet know how many other applications are competing for resources with such time-critical applications. You can use the workload management monitoring capabilities to determine this.
The sections that follow provide information about how to perform these steps.
Assume that you have two important business intelligence applications, BI1 and BI2 and that you need to minimize the response times for these applications. You can create workloads for these two applications and map them to a service class called MOSTIMPORTANT for which you can assign system resources.
On the AIX® operating system, you use the AIX Workload Manager to create a service class called MOSTIMPORTANT, and give this service class a guaranteed set of resources.
CREATE SERVICE CLASS MOSTIMPORTANT OUTBOUND CORRELATOR 'MOSTIMPORTANT'
CREATE WORKLOAD BI1WORKLOAD APPLNAME ('BI1') SERVICE CLASS MOSTIMPORTANT
CREATE WORKLOAD BI2WORKLOAD APPLNAME ('BI2') SERVICE CLASS MOSTIMPORTANT
For the purposes of this example, assume that even after you account for the known applications, a significant portion of the system workload is unaccounted for. You therefore need to better understand and possibly control this workload.
A long-running activity has a greater individual impact on the system than a short-running activity has because the long-running activity occupies system resources for a longer period of time. However, collecting information about a long-running activity imposes no greater overhead than would be imposed by collecting information on a short-running activity. As a result, the best way to collect information on the largest proportion of the workload is to collect information on the longest-running activities first.
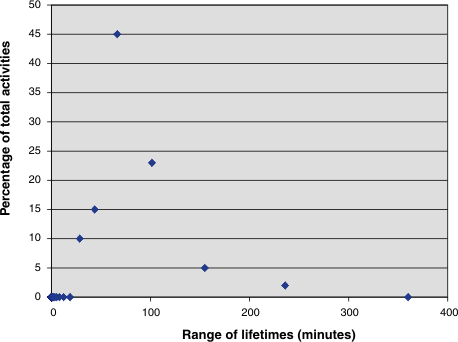
Start collecting activity information by first deciding on an activity lifetime above which you collect activity information. You can simplify this task by choosing a portion of the unclassified activities to be collected, such as 30%, and then observing the activity lifetime histogram for these activities. Allow the system to run so that the statistics are updated, then run the WLM_COLLECT_STATS procedure to send the statistics to an active statistics event monitor.
WITH TOTAL AS (
SELECT PARENTSERVICECLASSNAME,
       SERVICECLASSNAME,
       HIST.HISTOGRAM_TYPE,
       SUM(NUMBER_IN_BIN) AS NUMBER_IN_BIN
FROM HISTOGRAMBIN_DB2STATISTICS AS HIST,
     SYSCAT.SERVICECLASSES SC
WHERE
     HIST.SERVICE_CLASS_ID = SC.SERVICECLASSID
     AND HIST.TOP >= 0
     AND SC.PARENTSERVICECLASSNAME = 'SYSDEFAULTUSERCLASS'
     AND SC.SERVICECLASSNAME = 'SYSDEFAULTSUBCLASS'
     AND HIST.HISTOGRAM_TYPE = 'CoordActLifetime'
GROUP BY PARENTSERVICECLASSNAME, SERVICECLASSNAME, HISTOGRAM_TYPE)
SELECT CAST(CAST(TOP AS DOUBLE) / 60000 AS DECIMAL(14,3)) AS TOP_IN_MINUTES,
     CAST(100 * CAST(SUM(HIST.NUMBER_IN_BIN) AS DOUBLE) / TOTAL.NUMBER_IN_BIN AS DECIMAL(4,2))
     AS PERCENT_IN_BIN
FROM HISTOGRAMBIN_DB2STATISTICS AS HIST,
     SYSCAT.SERVICECLASSES SC,
     TOTAL
WHERE HIST.SERVICE_CLASS_ID = SC.SERVICECLASSID
      AND HIST.TOP >= 0
      AND TOTAL.NUMBER_IN_BIN > 0
      AND SC.PARENTSERVICECLASSNAME = 'SYSDEFAULTUSERCLASS'
      AND SC.SERVICECLASSNAME = 'SYSDEFAULTSUBCLASS'
      AND HIST.HISTOGRAM_TYPE = 'CoordActLifetime'
      AND TOTAL.PARENTSERVICECLASSNAME = SC.PARENTSERVICECLASSNAME
      AND TOTAL.SERVICECLASSNAME = SC.SERVICECLASSNAME
      AND TOTAL.HISTOGRAM_TYPE = HIST.HISTOGRAM_TYPE
GROUP BY TOP, SC.PARENTSERVICECLASSNAME, SC.SERVICECLASSNAME, HIST.HISTOGRAM_TYPE, TOTAL.NUMBER_IN_BIN;


TOP_IN_MINUTES   PERCENT_IN_BIN
---------------- --------------
           0.000           0.00
           0.000           0.00
           0.000           0.00
           0.000           0.00
           0.000           0.00
           0.000           0.00
           0.000           0.00
           0.000           0.00
           0.000           0.00
           0.001           0.00
           0.001           0.00
           0.002           0.00
           0.004           0.00
           0.006           0.00
           0.009           0.00
           0.014           0.00
           0.021           0.00
           0.033           0.00
           0.050           0.00
           0.077           0.00
           0.118           0.00
           0.180           0.00
           0.274           0.00
           0.419           0.00
           0.639           0.00
           0.975           0.00
           1.488           0.00
           2.269           0.00
           3.462           0.00
           5.280           0.00
           8.054           0.00
          12.286           0.00
          18.740           0.00
          28.584          10.00
          43.600          15.00
          66.505          45.00
         101.442          23.00
         154.731           5.00
         236.015           2.00
         360.000           0.00
CREATE THRESHOLD COLLECTLONGESTRUNNING30PERCENT
FOR SERVICE CLASS SYSDEFAULTSUBCLASS UNDER SYSDEFAULTUSERCLASS
ACTIVITIES ENFORCEMENT DATABASE ENABLE
WHEN ACTIVITYTOTALTIME > 100 MINUTES COLLECT ACTIVITY DATA CONTINUE
Allow the system to run so that data is collected.
Assuming that the overhead of collecting information on 30% of the longest-running activities is acceptable, you can let the data collection continue for a few hours or a few days. You can use the collected data to determine which users and applications produce the longest running of the 30% of the DML activities that are still unclassified. These activities might include some that are time critical. You might uncover some surprises, such as low-priority applications that run significant numbers of large activities. When you finish collecting and analyzing the data, you can drop the threshold.
SELECT SUBSTR (APPL_NAME, 1,16) APPLICATION_NAME,
       AVG(TIMESTAMPDIFF(4, CHAR(TIME_COMPLETED - TIME_CREATED)))
       AS AVG_LIFETIME_MINUTES
       COUNT(*) AS ACTIVITY_COUNT
FROM ACTIVITY_DB2ACTIVITIES
GROUP BY APPL_NAME
ORDER BY APPL_NAME

APPLICATION_NAME AVG_LIFETIME_MINUTES ACTIVITY_COUNT
================ ==================== ==============
MOSTLYSMALL1                      120             21
MOSTLYSMALL2                      110             15
UNIMPORTANTAPP                    150          10213
An analysis of the activities according to the submitting application shows that a large number of the longest-running activities were submitted by the UNIMPORTANTAPP application, which is a relatively unimportant application. You can use a workload to isolate this application from the other unclassified applications and map it to a service class called BESTEFFORT, which receives resources only when all other activities have their resource needs met.
According to the preceding results, the remaining applications in the default service class appear to submit few large activities. You might find it worthwhile to repeat the process of collecting activities executing in the default service class without restricting the collection to long-running activities.
ALTER SERVICE CLASS SYSDEFAULTSUBCLASS UNDER SYSDEFAULTUSERCLASS
COLLECT ACTIVITY DATA ON COORDINATOR WITHOUT DETAILSSELECT SUBSTR (APPL_NAME,1,16) APPLICATION_NAME,
AVG(TIMESTAMPDIFF(4, CHAR(TIME_COMPLETED - TIME_CREATED)))
AS AVG_LIFETIME_MINUTES
COUNT(*) AS ACTIVITY_COUNT
FROM ACTIVITY_DB2ACTIVITIES
GROUP BY APPL_NAME
ORDER BY APPL_NAME
APPLICATION_NAME AVG_LIFETIME_MINUTES ACTIVITY_COUNT
================ ==================== ==============
MOSTLYSMALL1 5 1501
MOSTLYSMALL2 7 124
ONLYSMALL 2 10123The results show that the ONLYSMALL application produces the majority of the unclassified activities. Because this application was not included in the results when you collected information about the largest activities, you can assume that ONLYSMALL did not produce any large queries during the period of data collection.