![[8.5.5.15 or later]](../images/ng_v85515.svg)
Usage metering for WebSphere Application Server (stabilized)
The usage metering feature extends the capabilities of the IBM Cloud Private metering service to on-premise or cloud-based WebSphere® Application Server servers. IT administrators or capacity planners can view, track, and report usage metrics in a single dashboard.
![[8.5.5.18 or later]](../images/ng_v85518.svg) Stabilized feature: The usage metering feature
is stabilized. It is currently used with WebSphere Automation and was
previously used with the now removed metering service in IBM Cloud Private. For general performance and metering needs,
consider using WebSphere Performance Monitoring
Infrastructure (PMI).
Stabilized feature: The usage metering feature
is stabilized. It is currently used with WebSphere Automation and was
previously used with the now removed metering service in IBM Cloud Private. For general performance and metering needs,
consider using WebSphere Performance Monitoring
Infrastructure (PMI).Track products across the enterprise, get usage reports to help optimize environments, and purchase WebSphere Application Server by using the Virtual Processor Core-Instance-Hours metric for container workloads. Without changing an organization’s infrastructure or topology, after a few easy registration steps, product instances call the metering service to provide basic usage metrics. These metrics are then displayed on the dashboard as simple usage graphs. You can view these graphs to help you make business decisions. For instance, they might show overused or underused instances, or help you, recognize when instances require upgrades for a security patch.
- Registration and inventory
- Register and track software product instances and usage all on one dashboard. Instances are organized by group or allow individual selection and exploration. You can query by platform, version, or other metrics to aid further analysis.
- Usage analysis
- View various product usage metrics, which are displayed over time, graphically to help analyze environments. By using these metrics, you can discover overused or underused instances to help improve your efficiency.
- Hourly pricing
- Generate a monthly report that details the hourly usage of virtual processor cores per instance. You can then use the generated report to determine the number of Virtual Process Core-Instance-Hours that must be purchased to use an hourly pricing license.
Registration
- Unique server instance identifier Each server instance is uniquely identified by four attributes:
- Product identifier
- Host name, first 12 characters of a container ID, or the Cloud Foundry application_name variable
- Product installation or directory
- Server name, full container ID, or the Cloud Foundry application_id_INSTANCE_INDEX variable
- Product edition
- Admin Console URL
- Installed APARs
- JVM version and fix level
- Operating system version
- Group identifier, such as department identifier or a usage identifier
Usage
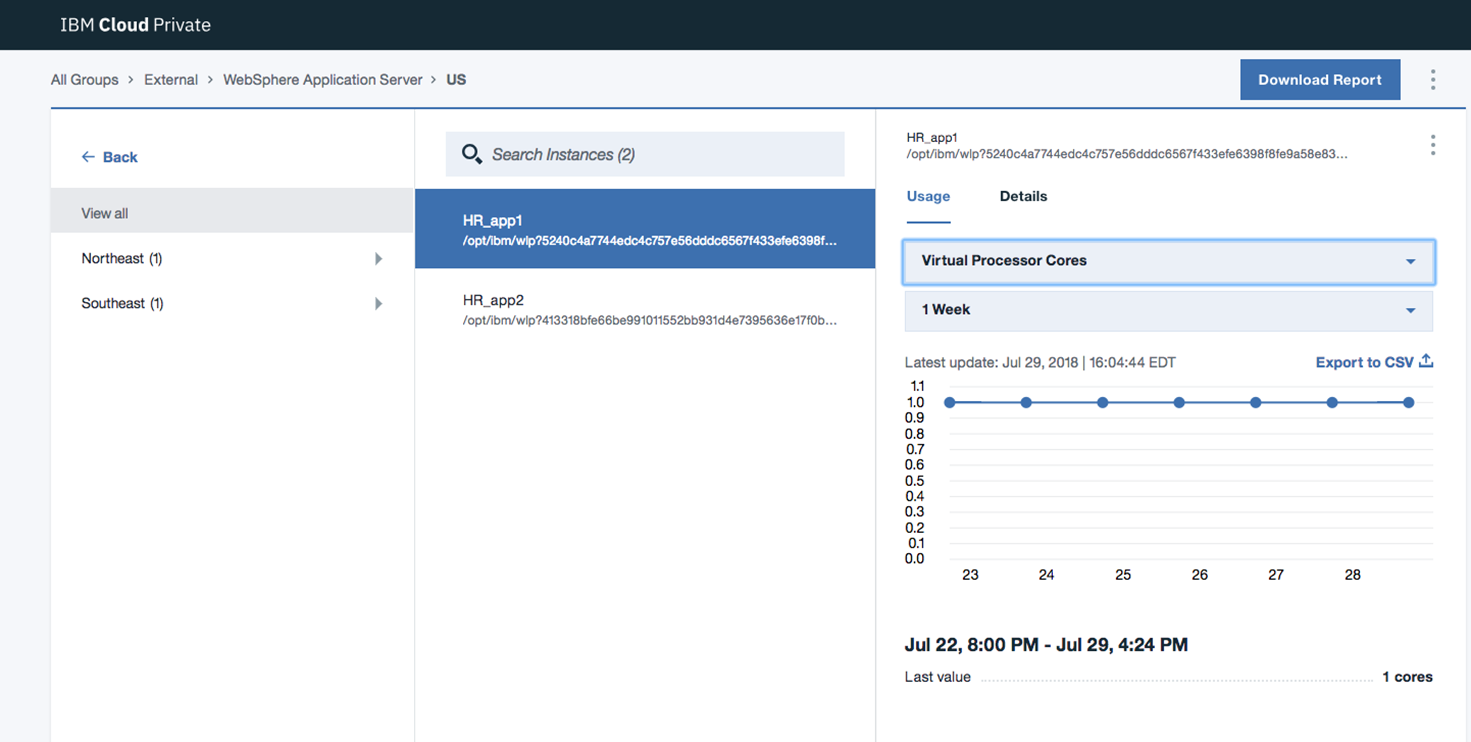
After successful registration, the usage metering feature collects and reports metrics to the metering service every 15 minutes. The metrics can be viewed graphically from the Usage tab of the IBM Cloud Private metering service dashboard.
| Metric | Identifier | Description |
|---|---|---|
| CPU Time | CPU_TIME | CPU time that the process uses for the report interval
(OperatingSystemMXBean.getProcessCpuTime()) |
| Java Initial Memory | JAVA_INIT_MEMORY | Initial amount of memory requested at virtual machine startup
(MemoryUsage.getInit()) |
| Java Used Memory | JAVA_USED_MEMORY | Current number of megabytes used for memory
(MemoryUsage.getUsed()) |
| Java Committed Memory | JAVA_COMMITTED_MEMORY | Current number of megabytes committed to memory
(MemoryUsage.getCommitted()) |
| Java Maximum Memory | JAVA_MAX_MEMORY | Maximum memory size in megabytes (MemoryUsage.getMax()) |
| Java Memory After Garbage Collection | JAVA_MEMORY_AFTER_GC | If the JVM supports garbage collection, the number of megabytes that is used for memory after the last garbage collection (only if supported by the JVM) |
| Servlet Requests | SERVLET_REQUESTS | Number of servlet requests made during the report interval, if available. Obtained from the monitor-1.0 feature |
| Total Physical Memory | TOTAL_PHYSICAL_MEMORY | The total amount of physical memory
(OperatingSystemMXBean.getTotalPhysicalMemorySize()) |
| Virtual Processor Cores | VIRTUAL_PROCESSOR_CORES | Number of processors available to the Java virtual machine. Container limitations are accounted for and can result in a fractional value. |
Determining virtual processor cores
/sys/fs/cgroup/cpu/cpu.cfs_quota_us
/sys/fs/cgroup/cpu/cpu.cfs_period_us
For Docker, the CPU limits can be configured with --cpus setting or the
--cpu-period and --cpu-quota settings. For Cloud Foundry,
limitations can be defined with the cpu_quota_per_share_in_us identifier. If no
such limitation is set, then the Runtime.getRuntime().availableProcessors() object
is used for the virtual processor cores metric.
![[8.5.5.16 or later]](../images/ng_v85516.svg)
Configuring Reported Metrics
In prior releases of usage metering, all of the defined metrics are always sent to the metering
service. Now you can limit which of the optional metrics to report. The virtual processor cores
metric is not optional and is always reported. For WebSphere Application Server, you can specify the optionalMetrics property in the
was-usage-metering.properties file to limit which metrics are reported to the
metering service.
Hourly pricing
WebSphere Application Server supports an hourly pricing license option based on the Virtual Processor Core-Instance-Hours metric. Hourly pricing is available for WebSphere Application Server servers that run in container environments (including Kubernetes and OpenShift) and Cloud Foundry. You must enable the usage metering feature and reports for an instance of the IBM Cloud Private metering service to enable hourly pricing.
The Virtual Processor Core-Instance-Hours metric is calculated by the IBM Cloud Private metering service from the virtual processor cores metric that is reported by the usage metering feature in WebSphere Application Server. You can use the metering service when you install IBM Cloud Private at no additional charge.
Long running workloads have a monthly price cap. The metering service tracks usage per unique server instance identifier and caps the Virtual Processor Core-Instance-Hours metric at 160 hours per calendar month. The cap is maintained across server restarts if the unique server instance identifier remains unchanged. For example, the start command starts a previously stopped container and maintains the same instance identifier.
The IBM Cloud Private metering service dashboard provides the capability to generate a report that calculates the monthly Virtual Processor Core-Instances-Hours metric.
Departmental chargebacks
- Unique IBM Cloud Private instances
- A different instance of the IBM Cloud Private metering service can be used per department or usage categorization.
- Unique IBM Cloud Private namespaces
- A single instance of IBM Cloud Private is used by all servers with multiple unique namespaces that are created for each department or usage categorization. Each namespace is accessed with a different API Key value in the server configuration.
- Group identifier in WebSphere Application Server usage metering
- A single instance of IBM Cloud Private is used by all servers, and all servers register by using the same API Key. Each server for a department or usage categorization can specify a different group identifier in the server configuration, which is reflected in the metering dashboard.