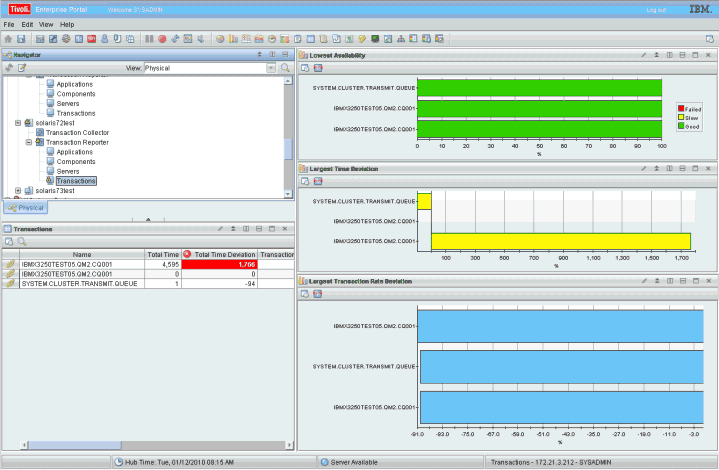
Transactions: Summary
This workspace provides general information about the performance of transactions on your managed system. Use this information to monitor transactions and determine if they have any problems.
Using this workspace
This workspace acts as a summary workspace for its category, and provides general information about transactions within applications, components, servers, or transactions. It contains four views in addition to the standard Navigator view:
- Lowest Availability
- Largest Time Deviation
- Largest Transaction Rate Deviation
- A summary table called Applications, Components, Servers, or Transactions depending on the category you select.

Use the Lowest Availability view to monitor whether transactions of a specific application, component, or server are slow or have failed. The data in this graph measures transactions that occurred during the last aggregation period. The default aggregation period is five minutes. The results of these queries are not sorted. The bars on the graph are color coded:
- Red indicates failed transactions
- Yellow indicates transactions that are running slow
- Green indicates good transactions.
If you move your mouse over different colored categories within a bar, hover help will indicate the relative percentage of that category. Right-click on the bar to link to more detailed workspaces for a particular application, component, server, or transaction.
Use the Largest Time Deviation view to determine which applications have the largest time deviation from a set baseline value. Positive numbers indicate transactions taking more time than the baseline value, and negative numbers indicate transactions taking less time than the baseline value. A deviation of zero indicates either that there is no deviation or that the deviation has not yet been measured.
Use the Largest Transaction Rate Deviation view to determine a deviation in the number of transactions of an application from its baseline value. Positive numbers indicate more transactions than the baseline value, and negative numbers indicate fewer transactions than the baseline value. A deviation of zero indicates either that there is no deviation or that the deviation has not yet been measured. The results of these queries are not sorted.
Depending on the category you select, the Applications, Components, Servers, or Transactions view provides a table that you can use to monitor the transactions on your applications. Table 1 describes the fields in this table.
| Column | Description |
|---|---|
| Name | The name of the Application, Component, Server, or Transaction. |
| Total Time | Measures the average time for a transaction
to complete, in milliseconds. The value in this column does not include
the time taken for failures, unless all transactions have failed.
The Total Time measures the following transactions
based on which category you are looking at:
|
| Total Time Deviation | Measures the percentage deviation from a baseline value. Positive numbers indicate a slower total time than the baseline value, and negative numbers indicate a faster total time than the baseline value. A deviation of zero indicates either that there is no deviation or that the deviation has not yet been measured. |
| Transaction Rate | Measures the average rate of transactions. This
is measured in transactions per minute. The Transaction
Rate calculates the following rate of transactions based
on which category you are looking at:
|
| Transaction Rate Deviation | Measures the percentage deviation from a baseline value in the number of transactions. Positive numbers indicate more transactions than the baseline value, and negative numbers indicate fewer transactions than the baseline value. A deviation of zero indicates either that there is no deviation or that the deviation has not yet been measured. |
| Percent Failed | Indicates the percentage of transaction instances that have failed. |
| Percent Slow | Indicates the percentage of transaction instances that are running slower than a preset threshold. |
| Percent Good | Indicates the percentage of transaction instances that are running faster than a preset threshold. |
| Timestamp | Indicates the start time of the period of aggregation. |
| Enclosing Component | Enclosing component aggregate if applicable. |
| Enclosing Server | Enclosing server aggregate if applicable. |
Accessing this workspace
Access this workspace by clicking on a category in the Navigator view, or by right-clicking a specific application, component, server, or transaction.
Links to other workspaces
You can select two extra detailed workspaces by clicking a link icon in the table view in the Transactions Summary workspace, the Transaction Instances workspace and the Historical Transaction Instances workspace. These are specific to the Transactions Summary workspace, and are not available from the other summary workspaces.