Configuring Web Response Time (Windows)
Administrators can configure Web Response Time for Windows.
- Make sure that you understand and collect the configuration parameters for this agent from Web Response Time parameters, and that you collect all the information in Information to collect before you begin installation and configuration. You use this information to complete these steps.
- If you selected Next from step 16 (in the section Install a monitoring agent on Windows systems), the installation software displays the Agent Advanced Configuration window.
- Specify the appropriate Tivoli Enterprise Monitoring Server connection
information:
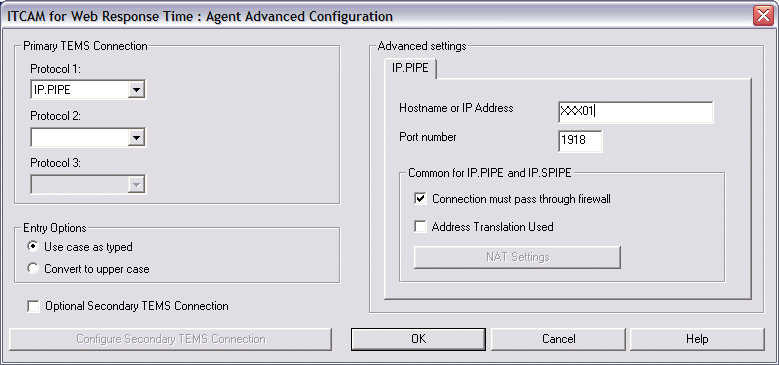
- In the Primary TEMS Connection section, specify
one or more connection methods to communicate with the monitoring
server. You have four choices: IP.UDP, IP.PIPE, IP.SPIPE,
or SNA.Note: You can specify three communication methods. These methods enable you to set up backup communication methods. If the method you use for Protocol 1 fails, Protocol 2 is used.
- In the Entry Options section, select the appropriate option to control whether entries are accepted as typed or all changed to uppercase.
- In the Advanced Settings section, the required information depends on which protocol you selected in the Primary TEMS Connection section. Verify the default host name and port, or modify these values along with other information requested as needed.
- Select Connection must pass through firewall if the agent and the Tivoli Enterprise Monitoring Server are on different sides of a firewall.
- Do not select Optional Secondary TEMS Connection. You can set up the standby support for agents after installation. See the IBM Tivoli Monitoring product documentation.
- Click OK to continue with Web Response Time agent basic configuration.
- In the Primary TEMS Connection section, specify
one or more connection methods to communicate with the monitoring
server. You have four choices: IP.UDP, IP.PIPE, IP.SPIPE,
or SNA.
- In the Web Response Time Basic
Configuration window, select the appropriate check boxes
as needed and enter extra information as requested. The input fields
change depending on which options you select. The option to monitor
all HTTP transactions is selected by default.
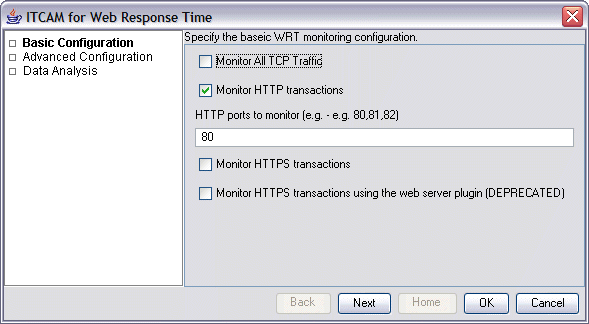
HTTP or TCP monitoring? If you select Monitor All TCP Traffic, TCP traffic is monitored and response time and bandwidth-related metrics for this traffic are available in the Application, Client, and Server workspaces. If you select Monitor HTTP transactions, a web request is merged with its object requests (such as GIF, or CSS). For TCP monitoring, each of these requests is counted separately. Therefore, a single HTTP transaction can equate to many TCP transactions. Depending on how you configure your Web Response Time agent, this information is displayed differently in the Web Response Time workspaces from the Network node in the Tivoli Enterprise Portal Navigator view. For more information about defining components in the Application Management Configuration Editor, see the Administrator's Guide.
Specify the following basic configuration information:- Optionally, select Monitor All TCP Traffic to enable the agent to monitor TCP traffic.
- Optionally, select Monitor HTTP transactions to enable the agent to monitor HTTP traffic (selected by default). In the HTTP Ports to Monitor field, specify one or more ports to monitor, separated by commas, with no blank spaces. The default is port 80.
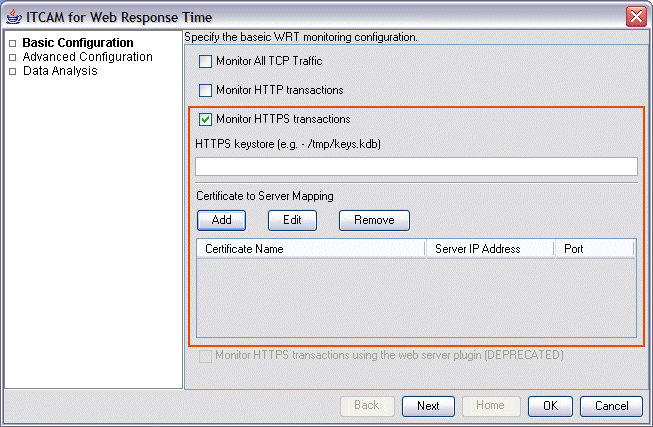
- Optionally, select Monitor HTTPS transactions to
enable the agent to monitor HTTPS traffic. Optionally, specify the
following extra information:
- Specify the HTTPS keystore which contains the remote certificates of the remote HTTPS websites to be monitored.
- Specify the Certificate to Server Mapping, which defines which remote servers will be monitored, and the SSL certificate that is used by each remote server. Use the Add, Edit, and Remove functions to define certificate names, server, and port information.
- Click Next to continue to the Advanced Configuration window.
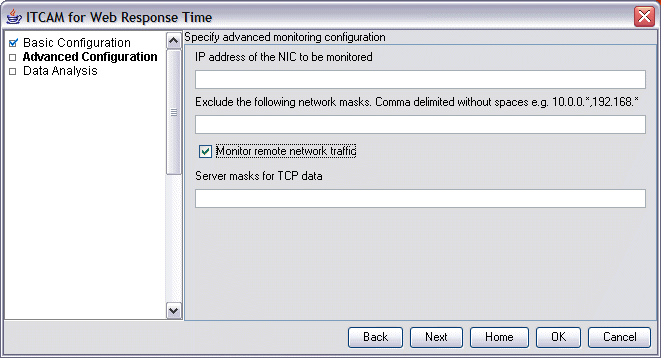
- In the Web Response Time Advanced
Configuration window, specify other optional configuration
information as needed.
- The IP address of the selected NIC card to be monitored.
- One or more network masks to be excluded from monitoring, separated by commas with no blank spaces. For example, you might enter 9.48.152.*,9.48.164.*, which prevents traffic on subnets 9.48.152 and 9.48.164 from being processed.
- Select the Monitor remote network traffic check box if you want to monitor all network traffic on the NIC. If you do not select this option, only the local traffic to and from the local IP address is monitored.
- One or more server masks for TCP data monitoring, separated by
commas with no blank spaces (for example, 10.0.0.*,192.168.*).
TCP data from an IP address that matches one of these masks is marked
as coming from a server, and not a client group.
Use this field when you are using multiple Web Response Time agents to provide TCP tracking data to Transaction Reporter. In this scenario, to display TCP topology correctly, this data is displayed in the resulting topology view as coming from a server instead of a client. For example, suppose Web Response Time agent WRT1 observes traffic from clients to server 9.48.152.Web Response Time agent, WRT2, observes traffic from server 9.48.152.1 to server 9.48.152.2. In this case, WRT2 should be configured with a server mask that includes 9.48.152.1.
- Click Next to
continue to the Data Analysis window where you
can specify more configuration information to define how the collected
data is to be analyzed.
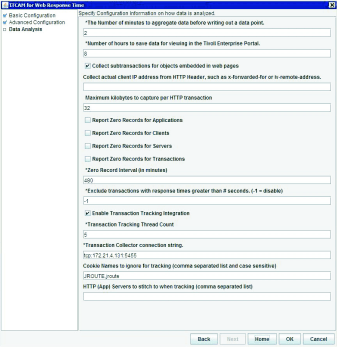 Accept the defaults, or optionally specify the following information:
- In the Number of minutes to aggregate data before writing out a data point field, specify the number of minutes to aggregate data before it is saved and summarized into an aggregate data point. The default is every 5 minutes. For example, to see data in larger aggregate intervals (for SLA reporting without diagnosis), change the default value from 5 minutes to a larger value, such as 15, 30, or 60 minutes.
- In the Number of hours to save data for viewing in the Tivoli Enterprise Portal field, specify the number of hours that data is saved for viewing in the Tivoli Enterprise Portal. The default of 8 hours causes the Tivoli Enterprise Portal to display aggregate data that has been collected over the last 8 hours.
- Optionally, select Collect subtransactions for objects embedded in web pages to indicate that subtransactions should be collected for embedded objects such as GIFs in web pages.
- Optionally, in the Collect actual client IP address from HTTP Header field, specify the header that you want to contain incoming client IP addresses. If you do not specify a header and are using a load balancer for example, all packets processed by Web Response Time have the IP address of the load balancer.
- In the Maximum kilobytes to capture per HTTP transaction field, specify the maximum number of kilobytes in each HTTP request or reply. The default is 32 kilobytes.
- Optionally select the check boxes for reporting zero records for applications, clients, servers, or transactions during the zero record interval.
- In the Zero Record Interval field, specify the number of minutes to continue to report zero records. The default is 480 minutes (8 hours).
- Optionally, in the Exclude transactions with reponse times greater than # seconds field specify a response time threshold value in seconds. Specifying a value causes any transactions with response times greater than the threshold value to be excluded from all calculations. The default value is -1, which disables this function and includes all transactions, regardless of their response time, in the calculations.
- Optionally, select Enable Transaction Tracking Integration to
cause the Web Response Time agent
to send its data to the Transaction Collector with
generated Transaction Tracking API events
for transaction tracking integration. Accept the additional default
values that are displayed, or specify your own values for the following
parameters:
- Transaction Tracking Thread Count (default is 5)
- Transaction Collector connection string
- Cookie names to ignore for tracking - a comma-separated, case-sensitive string of cookie names to ignore during tracking
Note: You cannot enable Transaction Tracking integration if HTTPS (plug-in mode) is enabled. The Web Response Time agent cannot obtain the necessary tracking information from transactions that are monitored in HTTPS plug-in mode. - Optionally, in the HTTP (App) Servers to stitch to when tracking field, list HTTP application servers to stitch to and for which you want to generate stitching data in Transaction Tracking API events. Specify the servers in a comma-separated list with the format IPAddress:TCPPort. You may use wildcards. Leaving the field empty is equivalent to a *:* entry.
- Click OK. A status window is displayed with the Configuring and starting agents, please wait message.
- (Optional): When installation is complete, the InstallShield Wizard Complete window opens.
- Click Finish.
- When the installation is complete, proceed to Verify installation of Response Time monitoring agents.