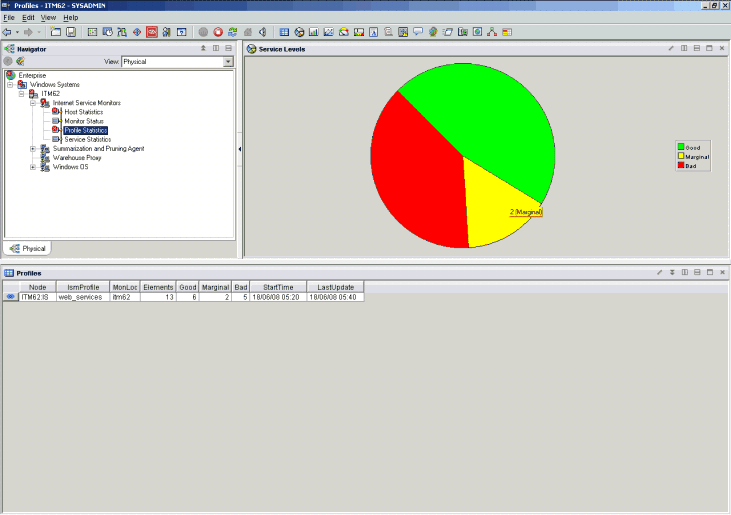
Profile Statistics workspace
The Profile Statistics workspace provides service level information for all profiles deployed on the system.
Using this workspace
- Service Levels
The Service Levels chart shows the current service levels reported by all profile elements. This chart represents the total number of results returned by profile elements, broken down by service level classification.
- Profiles
The Profiles table summarizes the results of each profile. Each row in the table contains summary data for one profile, showing the total number of profile elements that were active on the system at the most recent poll, as well as the totals for each service level classification.
From this table, you can access the Services workspace for any profile using the link provided.
Using this workspace, you can view the current status of service level agreements for all active profiles, and drill down to more detailed information about each profile.

Accessing this workspace
- In the Navigator Physical view, expand the operating system node for the machine on which the Internet service monitoring agent is located.
- Expand the node for the machine on which the Internet service monitoring agent is located.
- Expand the Internet Service Monitors node.
- Click Profile Statistics.
Links to other workspaces
You can link to Services workspace by right-clicking the link beside any profile in the Profiles table.