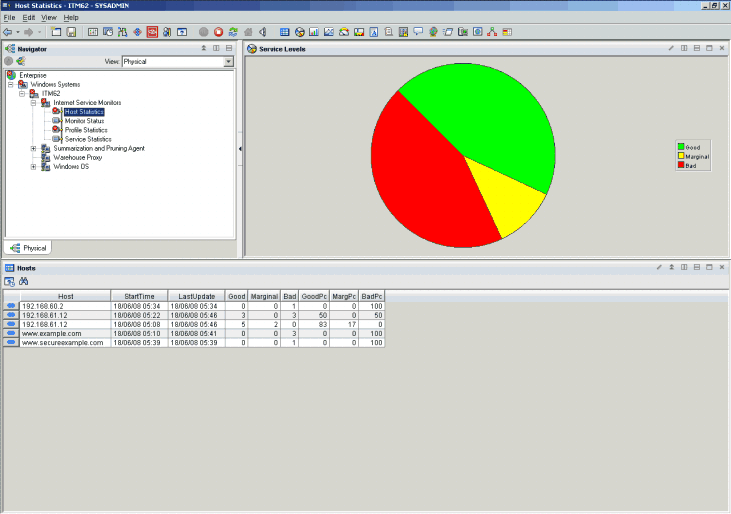
Host Statistics workspace
The Host Statistics workspace provides a summary of service level information for all hosts currently being monitored using profiles deployed on the system.
Using this workspace
- Service Levels
The Service Levels by Monitor chart shows the total number of Internet service tests currently performed on all hosts, broken down by service level classification.
- Hosts
The Hosts table summarizes the service level classifications for each monitored host. It lists individual totals for each service level classification, and shows those values as a percentage of the total number of tests performed on that host. Each row in the table contains summary data for one monitored host.
Use the workspace to gain an overview of all monitored Internet services on a per-host basis. Use the workspace links to access more detailed information about a single host.

Accessing this workspace
- In the Navigator Physical view, expand the operating system node for the machine on which the Internet service monitoring agent is located.
- Expand the node for the machine on which the Internet service monitoring agent is located.
- Expand the Internet Service Monitors node.
- Click Host Statistics.
Links to other workspaces
You can link to the Host Elements workspace by right-clicking the link beside a host in the Hosts table.