Internet Service Monitoring architecture
The core components of the Internet Service Monitoring architecture are the Internet service monitors.
The Internet service monitors regularly poll or test Internet services
to check their status. The test results generate data for SLA evaluation,
reporting, and alert generation. Internet Service Monitoring can monitor the
protocols listed in Table 1.
| Protocols Internet Service Monitoring monitors | |||
|---|---|---|---|
| DHCP | ICMP | RADIUS | SNMP |
| Dial - deprecated in ITCAM for Transactions V7.3 | IMAP4 | RPING | SOAP |
| DNS | LDAP | RTSP | TCPPort |
| FTP | NNTP | SAA | TFTP |
| HTTP | NTP | SIP | WMS - deprecated in ITCAM for Transactions V7.3 |
| HTTPS | POP3 | SMTP | Combinations of the other protocols by using TRANSX |
Figure 1 shows a
typical Internet Service Monitoring deployment.
Figure 1. Internet Service Monitoring architecture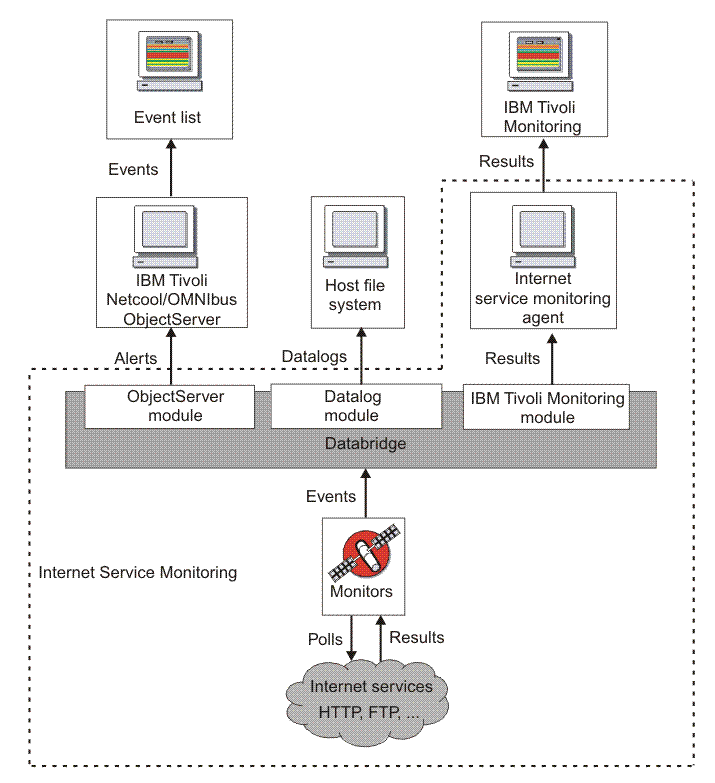
Figure 1 shows the following Internet Service Monitoring components:
- Monitors
- Test the specific Internet services and forward the test results
to the Databridge.
They emulate the actions of a real user of the service. For example, the HTTP monitor periodically
attempts to access a web page by emulating requests that a web browser
would usually send when a user visits the page. It generates an event containing the results of the test
(including status information) which is sent to the Databridge.
Monitors are distinguished from IBM Tivoli Netcool/OMNIbus probes by their polling functions. Probes connect to an event source to acquire the event data that it generates, while monitors actively poll or test services at regular intervals by injecting transactions or queries into the target service, and generating performance evaluation data.
- Databridge
- Acts as the communications bridge between the monitors, the IBM Tivoli Netcool/OMNIbus ObjectServer, and the Internet service monitoring agent. The Databridge receives the results of service tests performed by the monitors and converts this data into different formats for processing by the ObjectServer and the monitoring agent. The Databridge can also generate XML datalogs that you can use for archiving or simple reporting purposes. Detailed reporting is available within IBM Tivoli Monitoring through workspaces.
- Internet service monitoring agent
- Converts test results into the format required by IBM Tivoli Monitoring.
- ObjectServer module
- Converts events into alerts containing SLA and performance data and sends these alerts to the IBM Tivoli Netcool/OMNIbus ObjectServer. IBM Tivoli Netcool/OMNIbus users can then view service status information in the Event List. IBM Tivoli Netcool/OMNIbus ObjectServer and the Event List are part of IBM Tivoli Netcool/OMNIbus and are not installed with Internet Service Monitoring.
- Datalog module
- Converts test results to XML and then sends this information to a host file system for archiving or simple reporting purposes. The XML is useful for customers who have developed their own reporting tools and want to continue working with these tools.
- IBM Tivoli Monitoring module
- Sends results to the Internet service monitoring agent that uses a mapping file to convert the results into the format required by IBM Tivoli Monitoring for reporting in workspaces.