Introduction
IBM® Monitoring and Diagnostic Tools - Health Center is a diagnostic tool for monitoring the status of a running Java™ or Node.js application. Heath Center uses a small amount of processor time and memory, and can open some log and trace files for analysis.
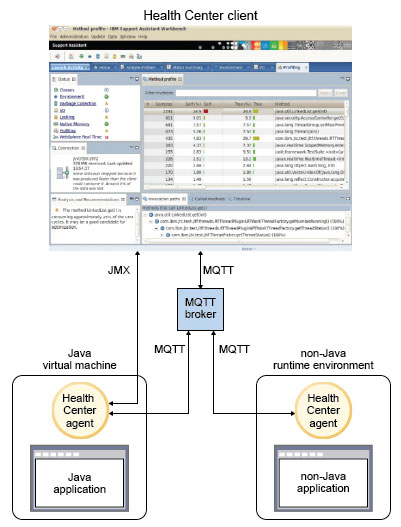
Tool components
- An agent, which collects data from a running application. Java applications are monitored by the Health Center agent (supplied with IBM SDK, Java Technology Edition). Node.js applications are monitored by the Node Application Metrics agent (supplied with the IBM SDK for Node.js).
- The Health Center client, an Eclipse-based GUI which connects to the agent. The client interprets the data that is obtained by the agent and provides recommendations to improve the performance of the monitored application. The client is available as an Eclipse plug-in and as part of IBM Support Assistant (ISA).
Application support
You can use Health Center to monitor Java or Node.js applications. Check the Platform requirements for supported SDK levels.
You can monitor applications that are running in IBM Bluemix®. The applications must be running in the Liberty for Java or SDK for Node.js runtime environments, which include a monitoring agent by default. For more information about Bluemix runtime environments, see Runtimes overview in the Bluemix documentation.
Client overview
- After installing the monitoring agent and enabling an application for monitoring, make a connection to the running application. See Monitoring a running application for more information.
- Open a log file from disk by canceling the wizard. See Loading saved data for more information.
- Classes: Information about classes being loaded
- CPU: Processor usage for the application and the system on which it is running
- Environment: Details of the configuration and system of the monitored application
- Garbage Collection: Information about the Java heap and pause times
- I/O: Information about I/O activities that take place
- Locking: Information about contention on inflated locks
- Method Trace: Information about method use over time
- Native Memory: Information about the native memory usage
- Profiling: Provides a sampling profile of Java methods including call paths
- Threads: Information about the live threads of the monitored JVM
- WebSphere® Real Time for Linux : Information about real-time applications
These views are represented as Eclipse perspectives. The first view you see is the Status perspective, listing the views and their overall status. When you connect to a running application or open a file, views with data available become links and any recommendations are reported. See Loading saved data for more information. The Health Center updates the reported data and recommendations every 10 seconds. Switch to the perspectives by using the links or the toolbar icons. You can return to the Status perspective using the Status Summary icon.
Feedback and further information
You can send bug reports, feature requests, and feedback through your IBM representative, or you can post feedback or ask questions on the Health Center forum: https://www.ibm.com/developerworks/forums/forum.jspa?forumID=1461.
For more information about Health Center, including links to videos, see: https://www.ibm.com/developerworks/java/jdk/tools/healthcenter/index.html.