Monitoring with the CandleMonitor node
The CandleMonitor node is an optional component of the WebSphere® Message Broker Monitoring agent. This node collects message flow performance statistics for a broker and provides a mechanism for generating user-defined events within a message flow. These events can be used by situations to detect abnormalities in the message flow. For example, statistics that are generated by a CandleMonitor node can be used to create a situation that automatically stops a message flow that has messages flowing along an abnormal path.
This section provides instructions for installing, enabling, and positioning the CandleMonitor node to monitor message flow statistics and events, turning monitoring off and on, and customizing the CandleMonitor node.
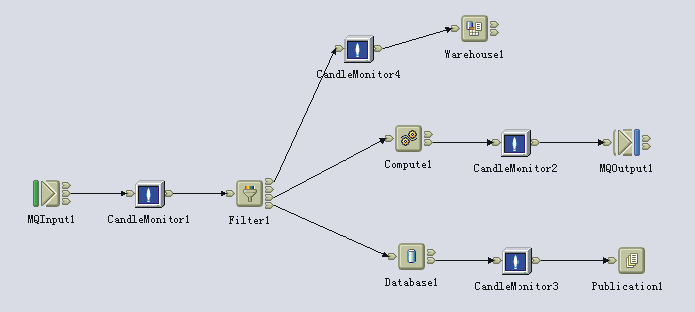
The CandleMonitor node is a simple passthrough node with one input terminal and one output terminal, which is placed in a message flow to collect statistics (see Figure 1). Messages passing through the CandleMonitor node are propagated between its input and output terminals without change. The CandleMonitor node is implemented in the kqipnode.lil (or kqipnode64.lil) file.
You can use the CandleMonitor node to take the following actions:
- View message flow reports at broker, execution group, message flow, and node levels
- Detect high input and output rates in message flows
- Detect high average time spent in message flows
- Detect high queue times for input to message flows
- Determine which part of a message flow is taking more time
- View statistics from the last sampling interval and average values taken over a particular period of time
- Be alerted to non-normal or low-use paths
- Detect events and trigger automatic responses
By default, statistics are sampled once per minute and events are sampled once every 15 seconds.