Question & Answer
Question
What's new with Hierarchy Level Behavior in Planning Analytics Set Editor?
Answer
Assumptions
This document assumes basic to intermediate knowledge of Planning Analytics and TM1 modeling practices.
Overview
Historically TM1 has labeled its hierarchy levels where level 0 is the leaf level and the highest number is the top level.
This behavior persists today in Architect and Perspectives, but with the new set editor released in the 2nd version of Planning Analytics, the behavior in the set editor now follows industry standard MDX practices where level 0 is the highest level and the highest number is the leaf level. In other words, the reverse of what it was previously.
End users should be educated in this change as to avoid confusion when working with the data.
This issue is best highlighted when editing a set. First let’s look at Architect. In this example the plan_time dimension is opened and all elements are shown.

If we filter by levels as shown below, the 0 level will be the leaf level.

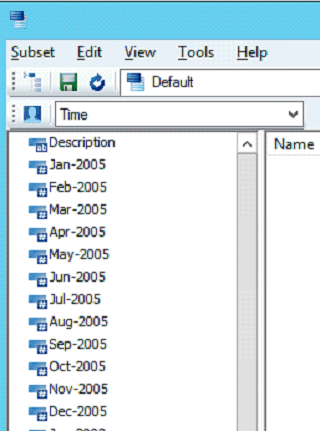
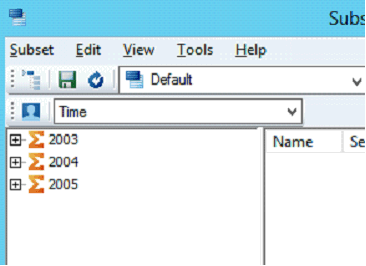
And if we filter the level on 2, in this case, it will return the highest level.
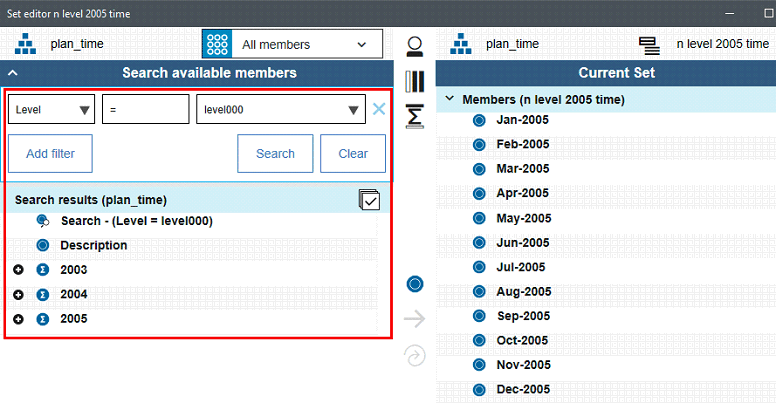
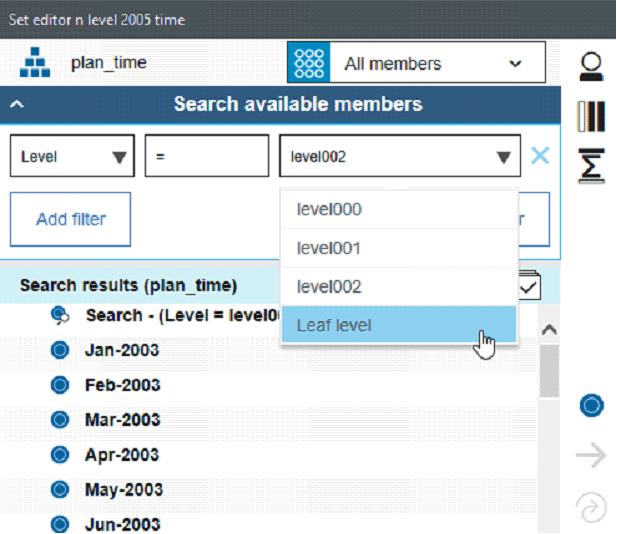
Conversely in the Planning Analytics Set editor in Planning Analytics Workspace or Planning Analytics for Excel, the reverse filtering method is true and is in alignment with standard MDX queries. In this example, we are filtering on level000 which returns the top level as seen below.
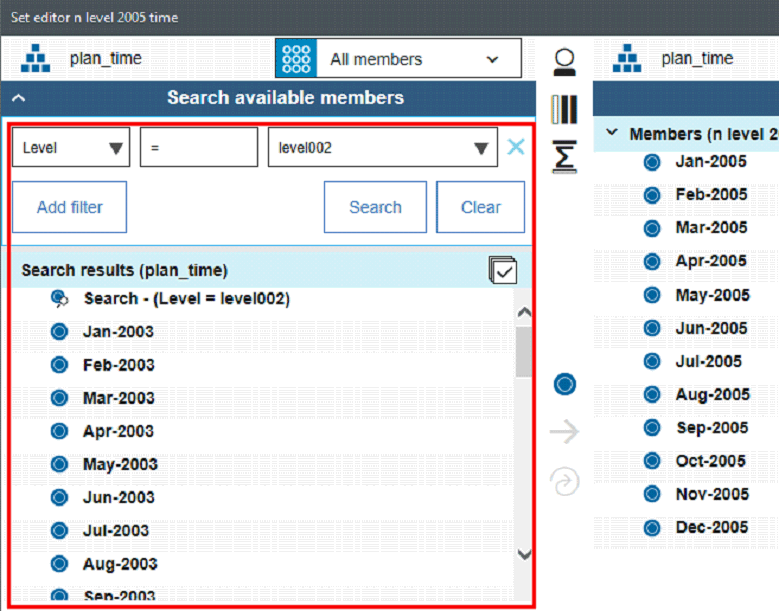
And if we filter on level002, it returns the leaf level as seen below.
The set editor also provides an easy method to filter on the leaf level by providing an easy to use Leaf Level option in the filter.
Before we get into some solutions to simplify the end user experience, remember that if users are proficient in MDX syntax including TM1-specific MDX functions, they can always quickly build their expression-based subsets by editing the MDX in the Set Editor.
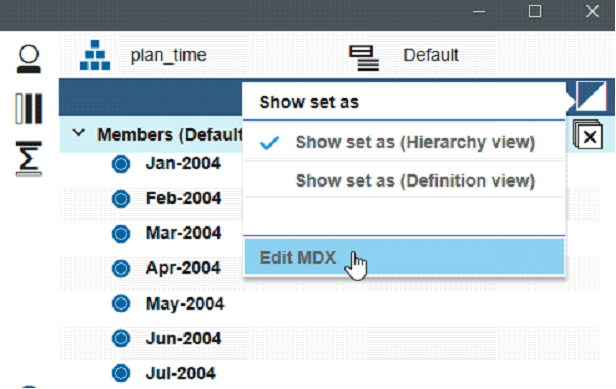
For example, the following standard MDX expression would return all leaf level elements in our example:
[plan_time].[plan_time].levels(2).MEMBERS

If you wanted to return the top level elements, you could use the following expression:
[plan_time].[plan_time].levels(0).MEMBERS
Again, where 0 is the highest level and 2 is the lowest level in the example.
Conversely, you could use TM1-specific MDX functions to create the old behavior in the set editor’s MDX expression by using the following syntax which returns the leaf level:
{TM1FILTERBYLEVEL( {TM1SUBSETALL( [plan_time] )}, 0)}
Or, the following to return the highest level in our example:
{TM1FILTERBYLEVEL( {TM1SUBSETALL( [plan_time] )}, 2)}
Where 0 is the leaf level and 2 is the top level.
Methods to Simplify the User Experience
Create Named Levels
One method is to give your hierarchy levels meaningful names for your end users.
To do so:
In Architect, ensure you have enabled Display Control Objects under the View menu.
Find and open the }HierarchyProperties cube and then from the Dimensions drop down list, select the dimension you would like to override the naming convention for.
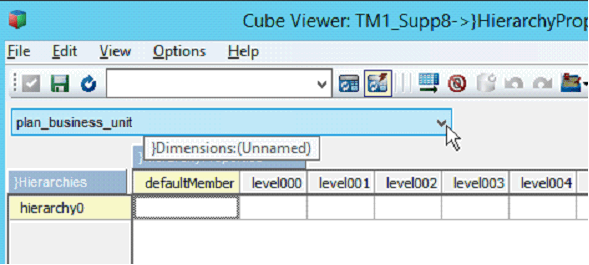
In this case we will select plan_time and provide the following level names.
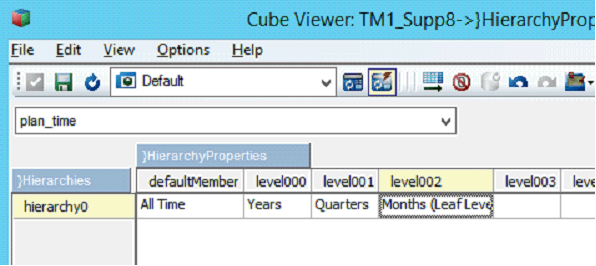
Save the View as Default and not Private.

Now the plan_time dimension’s hierarchy needs to be updated. To do so, we will run a TI process. Right-click Processes in the left pane and click Create New Process.
Click the Advanced tab and then the Prolog tab.
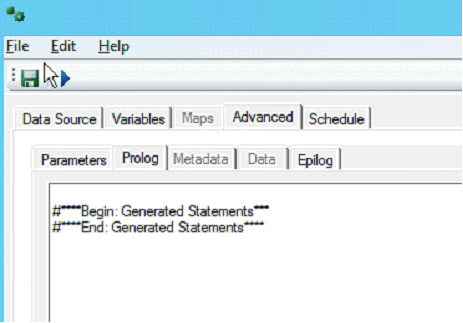
After the Generated Statements section, enter the following syntax where DimensionName is replaced with the dimension you want to update. RefreshMdxHierarchy('plan_time');
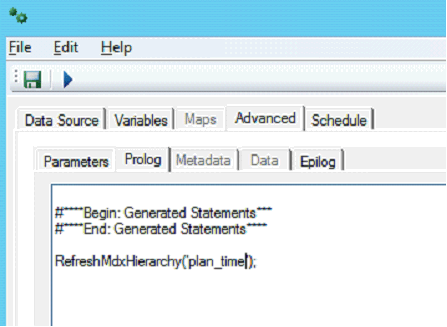
Save the Process with an appropriate name and then click on Run to execute the TI process.
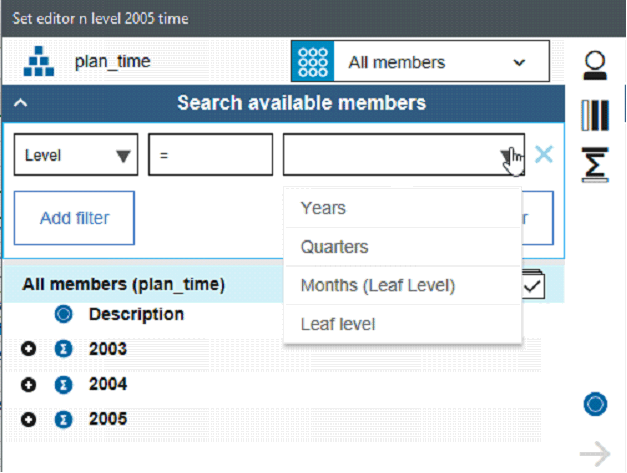
Now in the Planning Analytics Set Editor, the level names will appear in a more meaningful way.
Dealing with Ragged or Unbalanced Hierarchies
In some cases, the hierarchies may present elements at the same level as your consolidated levels which you may not want to display in your results when working in the Set editor.
In our example, we can see this with the Description element being displayed when filtering on the Year level.

A simple way to make the user experience more focused is by creating appropriate subsets.
In this case you could create and save a Public subset for the dimension that only displays the Years. In this case a subset called All Years.

With this selection, users have a focused list of elements to work with which they can also expand and there is no need for the extra clicks involved in filtering.

Notice description is no longer present.
Was this topic helpful?
Document Information
Modified date:
15 June 2018
UID
swg22013219