Question & Answer
Question
Does the IBM ViewONE Virtual viewer have any diagnostic windows and how do I access them?
Answer
IBM ViewONE Virtual has two main diagnostic windows that can be used:
"System Information" window
This is the most commonly requested window during any viewer support process and is nicknamed the "Shift t" window.
It is accessible when the focus is on the viewer by holding the "shift" button on your keyboard and pressing the letter t.
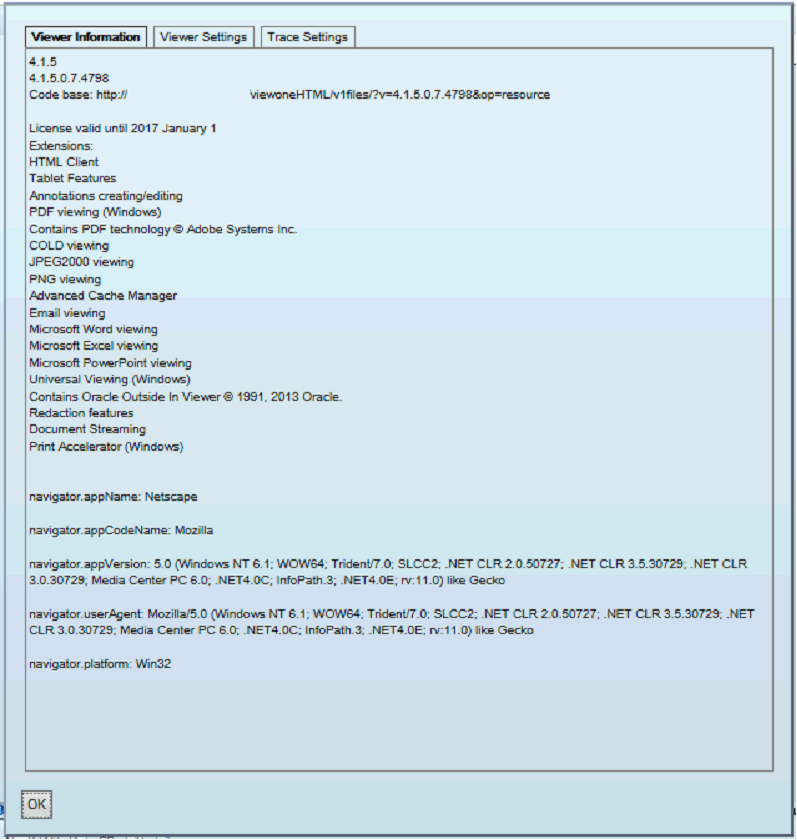
In the system information window we see several tabs.
Under the Viewer Information tab we have exactly that; basic information on the viewer:

In the Viewer Settings tab we have all the viewer parameters that have been specified to the client.

For the two above tabs you may be asked for this detail.
You will have to manually highlight and copy each page into a text file for submission to IBM.
In the Trace Settings tab we have all the viewer tracing that can be enabled for this session.
Here you can enable the tracing for this current session but we would always generally recommend you add the tracing via the web page of the viewer or via the application interface, as ticking the boxes on this page only enables the traces for this viewer session, and cannot be enabled prior to start up, so any annotation load, viewer startup or document load issue may well have occurred prior to you being able to enable them here.
Depending on the system these are enabled in different ways and are discussed in more detail in other technotes specific to those systems.

This is where we can also get the client console log for ViewONE Virtual.
You can see the button labelled "Log Console", Click this button.
This will open a new tab in your browser that shows the client logging.
At the bottom of this page you will see two buttons:
PLEASE DO NOT CLEAR THE CLIENT LOG UNLESS INSTRUCTED as this will delete all your reproduction steps up to this point.
Use the "Download Log" button. You should see a standard browser open/save dialog.
Please save this log.
You can see a Copy button at the bottom of this page. For most issues reported to IBM you will be asked for this detail so please click the Copy button and paste into a text file for delivery in the zip file with the other requested logging.
"Image Properties" Window
It is accessible when the focus is on the viewer by holding the "shift" button on your keyboard and pressing the letter i.
It contains information on the document being rendered:

When supplying this page to IBM a screen shot should be sufficient.
Was this topic helpful?
Document Information
Modified date:
28 January 2021
UID
swg21989184