Question & Answer
Question
How to alert when the number of Sniffer (Inspection-core) restarts is high on a Guardium Collector. What checks can be done when I get the alert ?
Cause
The Guardium Sniffer (Inspection-core) can restart for many reasons.
It is the responsibility of the Guardium administrator to react when a large number of Sniffer (Inspection-core) restarts occurs within a certain period - eg 3 or more in an hour
Common reasons for a large number of sniffer restarts are :-
- Crash of the sniffer process
- Engine Buffers become full
- Logger queues filling up - system out of memory - can be caused by any of
- Too much traffic coming in from the STAPs
- High Level of traffic being captured by Policy rules eg Log Full details
Answer
Below are some Alerts that you can import for either a Collector or a Central Manager as indicated.
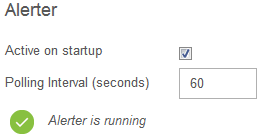
The Alerter must be running in order to receive an alert (or have the alert write to the syslog )
(v9 Administration Console->Configuration->Alerter. v10 Setup -> Tools and Views -> Alerter)
v9
 v10
v10 
Pre made alert definitions
- v9 Tools - Config & Control -> Alert Builder. v10 Protect -> Database Intrusion Detection -> Alert Builder
- Find the Alert and click Modify
- And add receiver(s) at the bottom
- Apply
Definitions are available to import into your v9 (p300 and above) and v10 appliances. The definition is different for Collectors and Central Managers. There will be a compatibility warning when importing into v10 but it will import successfully.
The alerts and queries behind the alerts are configurable as per normal.
| Alert to download ---------------------------- | Unit Type Alert will run on ------------------------ | Alert Name / Notes ------------------- | Query Name Alert is based on ------------------- | Alert will fire ------------------------------- | Potential delay in receiving data / alerts ? ------------------------------- |
| Collector | -MySnifferRestart_alert | -MySnifferRestart | if >=3 restarts occur in an hour * Can be reconfigured by you of needed | Maximum of 30 minute delay | |
| Central Manager | -MyCMSnifferRestart_alert Needs CM Buffer Usage Monitor scheduled for upload regularly :- v9 Tools ->Report Building - Custom Table Builder-> upload data. v10 Comply -> Custom Reporting -> Custom Table Builder -> upload data. Simply set the schedule - eg restart every hour, do not repeat *NB schedule at 5 minutes past the hour so as to include the full previous hour data. | -MyCMBufferUsage | if any unit(s) have >=4 restarts in a two hour period * Can be reconfigured by you of needed | Based on the schedule - if as per the NB* - a maximum of 1.5 hour delay before notification | |
| Central Manager | -MyEntpriseSniffRestart_alert Make sure Unit Utilisation is enabled - Then schedule on the Central Manager ( v9 System View-> Unit Utilization. v10 Manage -> Unit Utilization ) eg restart every hour, do not repeat *NB schedule at 10 minutes past the hour so as to include the full previous hour period of data obtained from the above | -MyEntpriseSnifferRestart | if any unit(s) have >=3 restarts in any of the two previous 1 hour periods * Can be reconfigured by you of needed | Based on the schedule - if as per the NB* - a maximum of 1 hour 40 min delay before notification |
1. Import the .sql files above from GUI v9->Administration Console->Guardium Definitions->Import. v10 Manage -> Data Management ->Definitions Import. This must be done on the Central Manager if one exists in the environment.
2. Activate the appropriate alert for the unit type from GUI v9 Administration Console->Anomaly detection. v10 Setup -> Tools and Views -> Anomaly Detection
- Note - The default polling interval is 30 minutes. If you wish to alert more frequently to allow for faster detection this can be modified
The alert definitions supplied here will alert to the syslog only at this point - they do not contain any specific email receivers. You must add any receivers who will receive an alert email as appropriate by amending the Alert Definition
Other Appliances
- For appliances that the imports do not work for (maybe v8.2) there is an example of how to create the collector alert in the deployment guide section 3.9.8 under "Sniffer restarts alert"
Check the underlying data (optional)
You can check the underlying data by running the report that the alert is based on . For example for the Collector ...
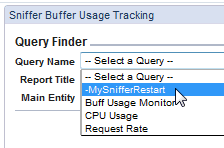
v9 Tools -> Report Building -> Sniffer Buffer Usage Tracking
v10 Investigate -> Query Builder -> Sniffer buffer usage monitor domain
pick the "-MySnifferRestart" Query - and in v9 "Add to Pane" - eg Daily Monitor. In v10 add to My Custom Reports, or add to a dashboard in My Dashboards.


Note - you can control the date range that the report is based on by customising the parameters
( in v9 click the pencil to the right hand side or in v10 the "wrench" icon) - You can change this to range for the last hour of data.

For the example below - for the past hour of data - there has only been 1 sniffer process ID running during that hour - hence no sniffer restarts have occurred . If that figure reaches 3 or more an alert is fired.

What checks can be done when I get the alert.
The following cli commands will provide analysis to help troubleshoot and resolve sniffer problems.
| support analyze sniffer | will put an analysis on the screen if any problems have been detected in a recent time period - nothing will return to the screen if a problem is not noticed |
| support must_gather sniffer_issues | produces a set of files including /must_gather/sniffer_logs/ANALYZE_RESULTS.txt that can be read via fileserver |
For 64 bit version v9.1 and higher there is an option to specify more sniffer threads depending on available memory.
What are the major improvements of 64bit Guardium
IBM Guardium Technical Support can also help analyse the must_gather sniffer_issues output file if needed - Please be sure to have a PMR and attach the must_gather sniffer_issues output file.
Related Information
Was this topic helpful?
Document Information
Modified date:
16 June 2018
UID
swg21698726