Question & Answer
Question
How can I trace WebSphere Garbage Collection (GC) runs for a specific IBM TRIRIGA server (JVM) I have? How can I set it up properly?
Cause
Need to know the impact of GC runs on system’s overall performance and determine if further tuning is needed for my IBM TRIRIGA system.
Answer
Garbage collection (GC) is an integral part of the Java Virtual Machine (JVM) as it collects unused Java heap memory so that the application can continue allocating new objects. The effectiveness and performance of the GC play an important role in application performance and determinism.
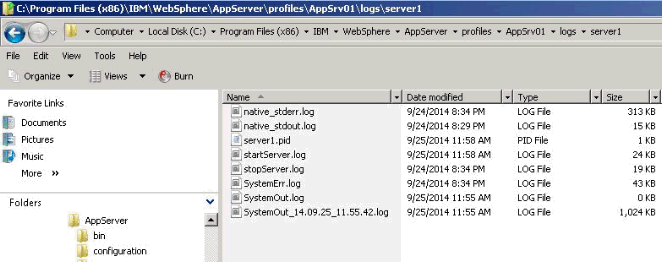
The Garbage Collection (GC) runs will be recorded on the native_stderr.log file located at folder “…ibm\websphere\appserver\profiles\<profilename>\logs\<servername>”.

When WebSphere “Verbose Garbage Collection” field is checked up, you will be able to trace the GC runs when it scan the JVM area and tries to release memory (dead objects, marked to be released).
See below a sample of the GC's log entries on the WebSphere log file native_stderr.log:
<exclusive-start id="365" timestamp="2014-09-24T20:33:19.686" intervalms="51729.016">
<response-info timems="0.033" idlems="0.033" threads="0" lastid="00000000446C5000" lastname="Thread-64" />
</exclusive-start>
<sys-start id="366" timestamp="2014-09-24T20:33:19.686" intervalms="263465.782" />
<cycle-start id="367" type="global" contextid="0" timestamp="2014-09-24T20:33:19.686" intervalms="263465.748" />
<gc-start id="368" type="global" contextid="367" timestamp="2014-09-24T20:33:19.686">
<mem-info id="369" free="739350400" total="1001127936" percent="73">
<mem type="nursery" free="15884400" total="195821568" percent="8" />
<mem type="tenure" free="723466000" total="805306368" percent="89">
<mem type="soa" free="683201296" total="765041664" percent="89" />
<mem type="loa" free="40264704" total="40264704" percent="100" />
</mem>
<remembered-set count="61510" />
</mem-info>
</gc-start>
<allocation-stats totalBytes="151134320" >
<allocated-bytes non-tlh="4064056" tlh="147070264" />
<largest-consumer threadName="WebContainer : 0" threadId="0000000042E27900" bytes="70046944" />
</allocation-stats>
<gc-op id="370" type="mark" timems="517.982" contextid="367" timestamp="2014-09-24T20:33:20.121">
<trace-info objectcount="2376805" scancount="2004015" scanbytes="69709952" />
<finalization candidates="2659" enqueued="870" />
<references type="soft" candidates="63651" cleared="0" enqueued="0" dynamicThreshold="31" maxThreshold="32" />
<references type="weak" candidates="19885" cleared="88" enqueued="70" />
<references type="phantom" candidates="363" cleared="5" enqueued="5" />
<stringconstants cleared="815" />
</gc-op>
<gc-op id="371" type="classunload" timems="0.698" contextid="367" timestamp="2014-09-24T20:33:20.122">
<classunload-info classloadercandidates="457" classloadersunloaded="24" classesunloaded="0" quiescems="0.000" setupms="0.026" scanms="0.552" postms="0.119" />
</gc-op>
<gc-op id="372" type="sweep" timems="5.694" contextid="367" timestamp="2014-09-24T20:33:20.125" />
<gc-end id="373" type="global" contextid="367" durationms="524.942" timestamp="2014-09-24T20:33:20.126">
<mem-info id="374" free="883327664" total="1001127936" percent="88">
<mem type="nursery" free="153195552" total="195821568" percent="78" />
<mem type="tenure" free="730132112" total="805306368" percent="90">
<mem type="soa" free="689867408" total="765041664" percent="90" />
<mem type="loa" free="40264704" total="40264704" percent="100" />
</mem>
<pending-finalizers system="591" default="279" reference="75" classloader="0" />
<remembered-set count="57449" />
</mem-info>
</gc-end>
<cycle-end id="375" type="global" contextid="367" timestamp="2014-09-24T20:33:20.274" />
<sys-end id="376" timestamp="2014-09-24T20:33:20.274" />
<exclusive-end id="377" timestamp="2014-09-24T20:33:20.274" durationms="701.706" />
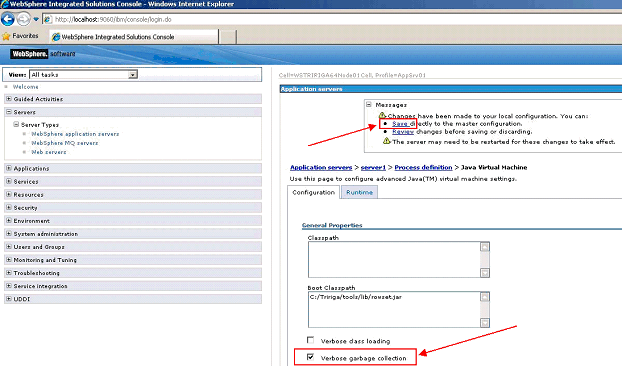
For activating GC trace, you need to log in WebSphere Admin Console -> Servers -> Server Types -> WebSphere Application Servers -> <Your server name – JVM> -> Process Definition -> Java Virtual Machine and then check mark the “Verbose garbage collection” field.
Apply the change and then for the warning message, click “Save” for confirming this change. You need to restart your server (JVM) so that the trace information starts to be printed out on the native_stderr.log log file.

Related Information
Was this topic helpful?
Document Information
Modified date:
17 June 2018
UID
swg21685616