Troubleshooting
Problem
Is there a method to determine the average size of incoming events in QRadar?
Resolving The Problem
An administrator can log in to the appliance that is processing events and run a command that provides a representation of the average event size. These values can be used to determine the average size of events, which when multiplied by the EPS rate, can give a representation of how much data is written to disk in bytes.
To determine the average event payload size and record size
The procedure listed gives you the size in bytes of the raw event payloads and normalized event records written to disk. The data reflects events written to ariel since the last restart of the ecs-ep (on a Console, Event Processor, Flow Processor, or Event/Flow Processor) or datanode (on a DataNode host) service.
- Use SSH to log in to QRadar Console as the root user.
- Optional. Open an SSH session from the Console to the managed host responsible for processing events, such as a 16xx or 18xx appliance.
- Based on the type query you choose to run, use one of the following commands:
Short query:/opt/qradar/support/jmx.sh -p 7799 -b "com.q1labs.ariel:application=ecs-ep.ecs-ep,type=Database writer,a1=events-*.$" -a AveragePayloadSize -a AverageRecordSize[root@QRadar74Console ~]# /opt/qradar/support/jmx.sh -p 7799 -b "com.q1labs.ariel:application=ecs-ep.ecs-ep,type=Database writer,a1=events-*.$' -a AveragePayloadSize -a AverageRecordSize com.q1labs.ariel:application=ecs-ep.ecs-ep,type=Database writer,a1=events-1 --------------------------------------------------------------------------- AverageRecordSize: 516.5108596449492 AveragePayloadSize: 1372.353294178426Full information:/opt/qradar/support/jmx.sh -p 7799 -b "com.q1labs.ariel:application=ecs-ep.ecs-ep,type=Database writer,a1=events-*.$"
[root@QRadar74Console ~]# /opt/qradar/support/jmx.sh -p 7799 -b "com.q1labs.ariel:application=ecs-ep.ecs-ep,type=Database writer,a1=events-2" com.q1labs.ariel:application=ecs-ep.ecs-ep,type=Database writer,a1=events--2 --------------------------------------------------------------------------- AverageRecordSize: 214.42109268543226 LocalNode: Local DataNode, 66593 records sent DatabaseRoot: /store/ariel/events/records AveragePayloadSize: 385.28398188922847 ProcessedRecordCount: 66593 ConnectedNodes: Local DataNode, 66593 records sent TimeOnline: 0:10:55.748 StoredRecordsCount: 66593 WrittenFilesCount: 4 PayloadRoot: /store/ariel/events/payloads StoredIntervalRecordsCount: 10954 WrittenPayloadFilesCount: 4 DroppedRecordsCount: 0 AverageRate: 101.67 records per second DisconnectedNodes: BucketInfo: -
To determine the average event payload size and record size on an Event or Flow Processor
/opt/qradar/support/jmx.sh -p 7799 -b "Database writer.*events-.$" -a AveragePayloadSize -a AverageRecordSize --noheader# /opt/qradar/support/jmx.sh -p 7799 -b "Database writer.*events-.$" -a AveragePayloadSize -a AverageRecordSize --noheader AveragePayloadSize: 414.2000000000001 AverageRecordSize: 254.0 -
To determine the average event payload size and record size on a DataNode
/opt/qradar/support/jmx.sh -p 7794 -b "Database writer.*events-.$" -a AveragePayloadSize -a AverageRecordSize --noheader/opt/qradar/support/jmx.sh -p 7794 -b "Database writer.*events-.$" -a AveragePayloadSize -a AverageRecordSize --noheader AveragePayloadSize: 413.6869262949478 AverageRecordSize: 253.88505446623094 -
To determine the event payload size for events seen on a specific Event Collector
Event Collectors do not store data so different steps are needed to find the metrics specific to a particular Event Collector host.-
SSH to the Event Collector
- Run this command to obtain the Event Collector ID:
/opt/qradar/support/jmx.sh -p 7777 -b 'com.q1labs.sem:application=ecs-ec.ecs-ec,type=filters,name=DSM' | grep ECID
This returns the Event Collector ID as the "ECID" value:
ECID: 7 -
Log in to the QRadar Console.
-
Click the Log Activity tab.
-
Add the AQL Query to the Advanced Search, replacing the '#' with the ECID value:
SELECT logsourcename(logSourceId) AS 'Log Source', QIDNAME(qid) as 'Event Name', logsourcetypename(devicetype) as "Log Source Type", strlen(payload) as "payloadSizeBytes" from events where "collectorId"='#' ORDER BY payloadSizeBytes DESC LIMIT 1000 last 5 minute -
Click Search.
Results
You conducted a search that shows which events have the highest payload size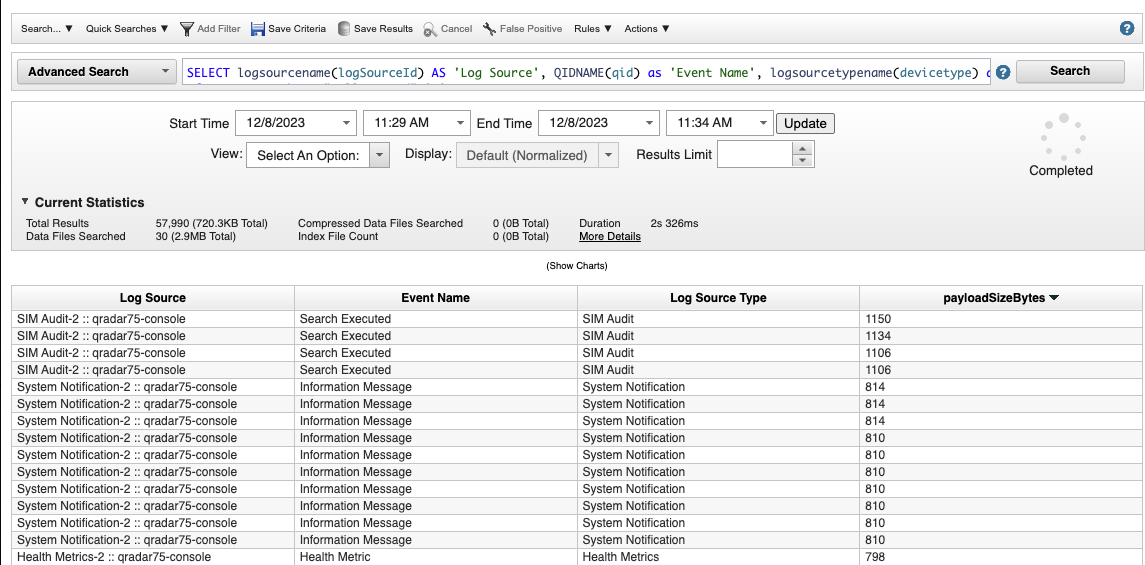
-
- To determine Health Metrics
-
Log in to the QRadar Console.
-
Click the Log Activity tab.
-
Add the AQL Query to the Advanced Search.
SELECT Hostname, "Component Type", "Metric ID", CASE "Metric ID" WHEN 'AveragePayloadSizeEvents' THEN LONG(AVG(Value)) WHEN 'AverageRecordSizeEvents' THEN LONG(AVG(Value)) ELSE 0 END AS AverageValueInBytes FROM events WHERE devicetype = 368 AND "Metric ID" IN ('AveragePayloadSizeEvents','AverageRecordSizeEvents') GROUP BY Hostname, "Component Type", "Metric ID" ORDER BY Hostname, "Metric ID" LAST 5 MINUTES -
Click Search.
-
Set the Values for the graphs to AverageValueInBytes.
-
Click Update Details.
Results
Graphs are created to display the Health metrics for the last five minutes.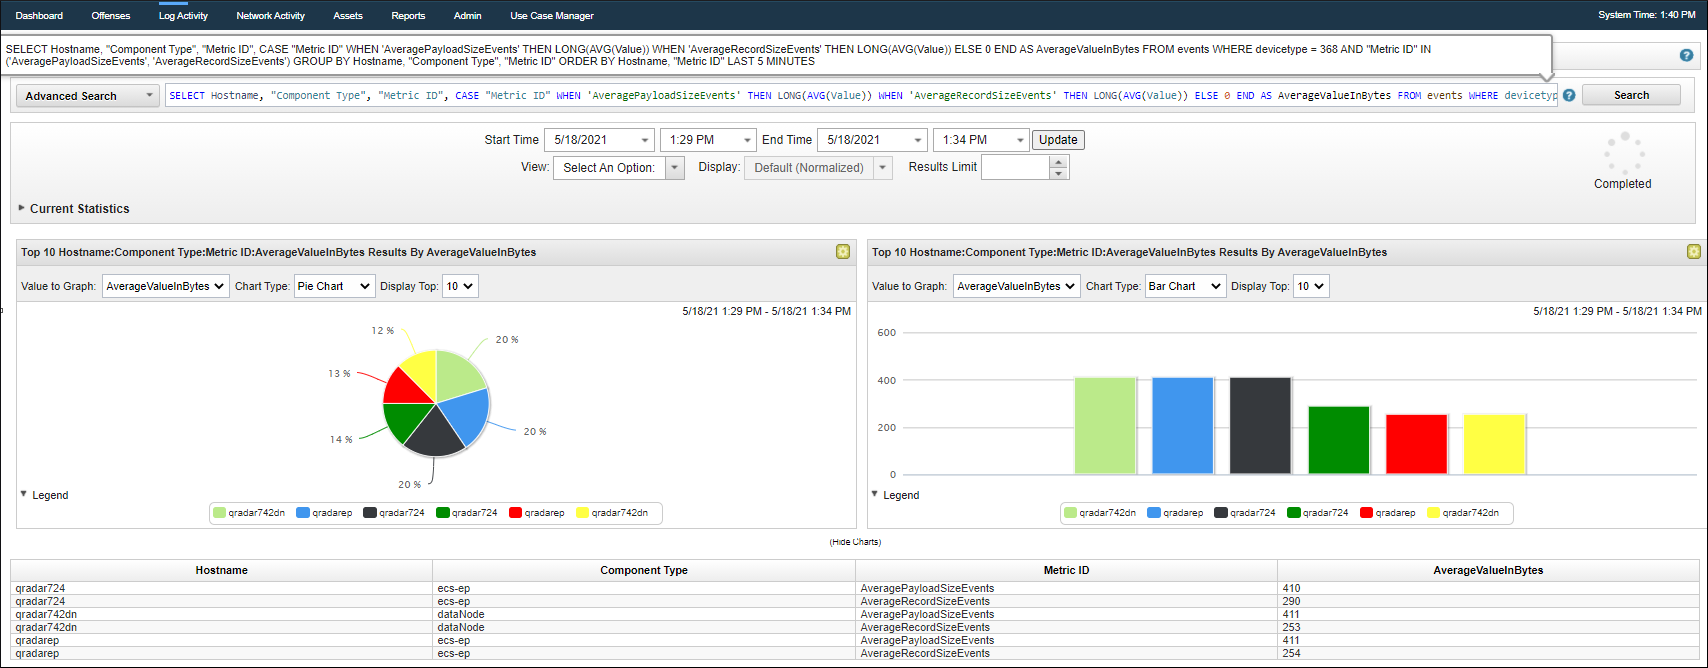
-
- Determine elapsed time since ecs-ep was started:
systemctl status ecs-ep | grep ActiveThe elapsed time is at the end of the line:Active: active (running) since Mon 2019-01-28 07:14:01 EST; 4h 12min ago
[{"Type":"MASTER","Line of Business":{"code":"LOB24","label":"Security Software"},"Business Unit":{"code":"BU059","label":"IBM Software w\/o TPS"},"Product":{"code":"SSBQAC","label":"IBM Security QRadar SIEM"},"ARM Category":[{"code":"a8m0z000000cwt0AAA","label":"Log Source"},{"code":"a8m0z000000cwtiAAA","label":"Performance"}],"ARM Case Number":"","Platform":[{"code":"PF016","label":"Linux"}],"Version":"7.4.0;7.5.0;and future releases"}]
Was this topic helpful?
Document Information
Modified date:
11 December 2023
UID
swg21685322