Question & Answer
Question
How to use the vwtool in CPE to trace Process and Case Foundation-related components?
Cause
vwtool is a command line-based interface for the CPE. The trace command in vwtool can be used to diagnose problems with Process and Case Foundation-related components, such as the Process and Case Analyzer services and the code module-based components.
Answer
NOTICE:
- The instructions and samples in this tech note are based on CPE V5.2.0.2. For other CPE versions, some steps may be different. Use this tech note as a general guide for other CPE versions, but pay close attention to potential variations.
- The purpose of this tech note is to show how to use the vwtool trace command. It is not an intention of the tech note to provide specific trace option settings for various scenarios. The trace options setting can vary for different CPE build levels. They also depend on symptoms of software behavior. Contact IBM software support for recommended trace options settings.
.
INSTRUCTIONS:
.
- On a CPE node, open a command prompt, and change directories to the [CPE installation location]\tools\PE directory.
- Enter the following command: vwtool [connection point name]
- where [connection point name] is a CPE connection point that is configured with the workflow system where you want to do the tracing.
- Example on Microsoft® Windows:
.

. - To log into vwtool, enter the credentials of an LDAP user who is a member of the Workflow system administration group for the CPE.
Reference:
http://www-01.ibm.com/support/knowledgecenter/SSNW2F_5.2.0/com.ibm.p8.planprepare.doc/p8ppi222.htm?lang=en - At the vwtool prompt, enter the command trace. After this, you have to answer a series of prompts to enable tracing.
- For the prompt Performed on all servers/single server (CR=a, s), hit the Enter key to enable tracing on all CPE nodes, or hit the 's' key and then the Enter key to enable tracing on a single CPE node only.
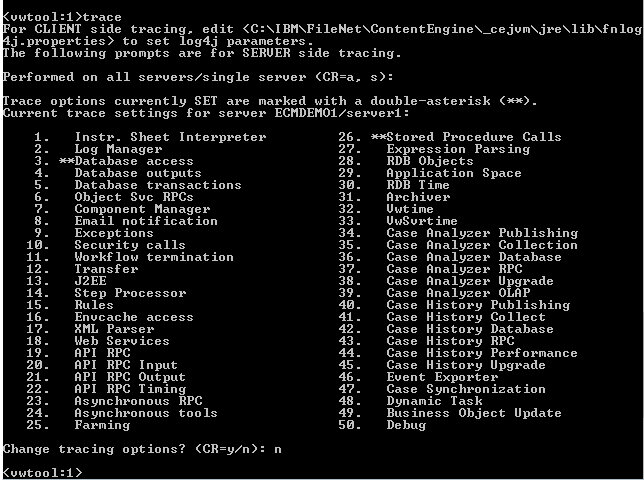
Note: if you select 's' to enable tracing on a single node only, then a list of available CPE nodes will be displayed. You will get the Enter server to trace (CR=default to the first one) prompt, where you can specify on which node to enable tracing. If you just hit Enter to answer the prompt, then you specify the first CPE node on the list. Typically, you enable tracing on all CPE nodes to capture the activity on all the nodes. - The tracing options are displayed. You will see '**' characters next to the options that are currently enabled.
In the example below, options 3. 26. are enabled:
.

. - For the prompt Change tracing options? (CR=y/n), hit the Enter key to change what options vwtool tracing will be enabled for. (Or hit the 'n' key and then the Enter key to leave the enabled tracing options the same.
- For the prompt Turn off all tracing? (y/CR=n), hit the Enter key to leave the currently enabled tracing options enabled, or hit the 'y' key and then the Enter key to disable them.
Note: if you chose the 'y' option to disable all tracing, then you will get back to the vwtool prompt. All vwtool tracing will be disabled at that point. You will have to type in the trace command at the vwtool prompt and step through the prompts again to enable tracing with new tracing options. Make sure you select the 'n' option at this prompt to continue to enable vwtool tracing. - For the prompt Extract new options form the traceOption file? (y/CR=n), hit the 'y' key and then the Enter key to select the options from a pre-configured traceOptions input file. Hit the Enter key to continue specifying tracing option at the vwtool prompt. The rest of the steps in this procedure assume you hit the Enter key here.
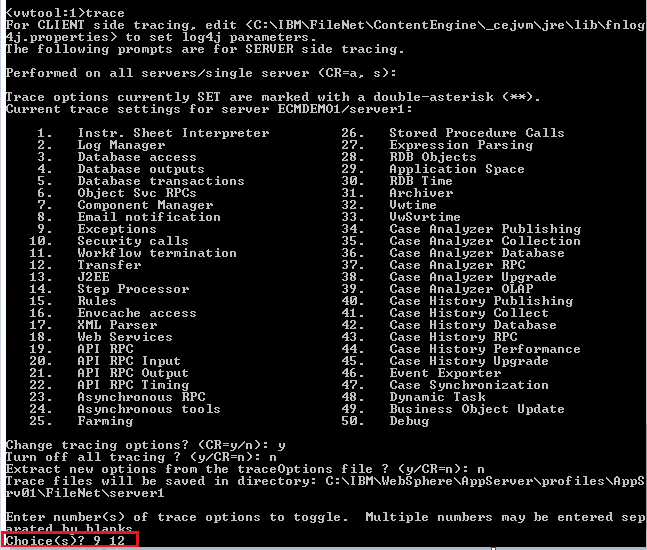
- For the prompt, Enter number(s) of trace options to toggle, enter the tracing options that you want to change. You can enter several options at once separated by a space character. tracing options currently disabled will be enabled. tracing options currently enabled will be disabled.
In the example below, all tracing options are disabled initially. We are enabling two tracing options at once:
9. Exceptions
12. Transfer
.

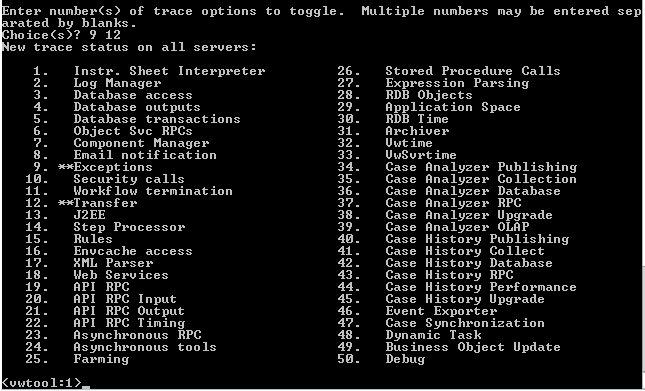
. - The resulting tracing option settings will take effect and be displayed.
For example, as a result of the settings selected above:
.

.
You will be back at the vwtool prompt with the tracing settings in effect. Now you can monitor the system or reproduce a problem that you want to trace.
.
Output File
The logging entries generated by vwtool tracing will be recorded in the pesvr_trace.log file.
To find out the location of the file, access the CPE ping page. (For example: http://server:port/FileNet/Engine .)
For example, when CPE is deployed on IBM WebSphere, then the location of the pesvr_trace.log file is similar to the following:
- ...\WebSphere\AppServer\profiles\AppSrv01\FileNet\server1\pesvr_trace.log
.
traceOptions File
Settings in the traceOptions file take effect at the time when the CPE starts up.
There are instructions how to use the traceOptions file at the following locations:
- IBM Knowledge Center
- At the beginning of the traceOptions.sample file provided with the CPE software.
http://www-01.ibm.com/support/knowledgecenter/SSNW2F_5.2.0/com.ibm.p8.pe.vw.doc/bpfvl049.htm?lang=en
The traceOptions.sample file is located in the [CPE installation location]\tools\PE directory.
Disable Tracing
When you want to disable all vwtool tracing, follow steps 1-8 in the procedure above. In step 8, for the prompt Turn off all tracing? (y/CR=n), hit the 'y' key and then the Enter key to disable all tracing options.
Was this topic helpful?
Document Information
Modified date:
17 June 2018
UID
swg21678454