Question & Answer
Question
How to monitor the pool size of the J2C Connection Factory used by Rule Execution Server ?
Answer
Execution Unit Dump ( XU Dump )
Capturing a XU Dump impacts performance heavily, The goal of the XU dump is to get the state of the XU caches and pools to diagnose an issue, it must not be requested periodically.
Provided the performance impact of this operation is not an issue, it is possible to generate an execution unit (XU) dump following instructions from the documentation. The generated dump XML document contains the list of connections in use by the XU, as in this example:

The following options based on WebSphere Application Server illustrate how to rely on application server specific infrastructure to monitor the XU connection pool as it is managed by the container. This allows to monitor the connection pool size in a less intrusive manner.
WebSphere Application Server J2CConnectionFactory MBean
For a given XU that is configured in a server there is a J2CConnectionFactory MBean that can be accessed through JMX API or by using the wsadmin command line utility. The following command lists all such MBeans on the sample server named "SamplesServer":
wsadmin>$AdminControl queryNames *:type=J2CConnectionFactory,process=SamplesServer,*
The output would contain for example the following MBean:
WebSphere:name=XU_CF,process=SamplesServer,platform=dynamicproxy,node=SamplesNode,diagnosticProvider=true,j2eeType=JCAConnectionFactory,J2EEServer=SamplesServer,JCAResource=JRulesXU,Server=SamplesServer,J2CResourceAdapter=JRulesXU,version=7.0.0.17,type=J2CConnectionFactory,mbeanIdentifier=cells/SamplesCell/nodes/SamplesNode/resources.xml#J2CConnectionFactory_1325638185879,cell=SamplesCell,spec=1.0
Running the following command would then allow to get information on the content of the connection pool:
wsadmin>set xu_cf [$AdminControl completeObjectName name=XU_CF,*]
wsadmin>$AdminControl invoke $xu_cf showPoolContents
The command gives the following type of output:
PoolManager name:eis/XUConnectionFactory
PoolManager object:2104589681
Total number of connections: 3 (max/min 10/1, reap/unused/aged 180/1800/0, connectiontimeout/purge 180/EntirePool)
(testConnection/inteval false/0, stuck timer/time/threshold 0/0/0, surge time/connections 0/-1)
Shared Connection information (shared partitions 200)
No shared connections
Free Connection information (free distribution table/partitions 5/1)
(1)(0)MCWrapper id 40404040 Managed connection ilog.rules.res.xu.spi.IlrManagedXUConnection@3fba3fba State:STATE_ACTIVE_FREE
(1)(0)MCWrapper id 594d594d Managed connection ilog.rules.res.xu.spi.IlrManagedXUConnection@47ad47ad State:STATE_ACTIVE_FREE
(0)(0)MCWrapper id 6ab36ab3 Managed connection ilog.rules.res.xu.spi.IlrManagedXUConnection@1abf1abf State:STATE_ACTIVE_FREE
Total number of connection in free pool: 3
UnShared Connection information
No unshared connections
WebSphere Application Server with Performance Monitoring Infrastructure (PMI)
On WebSphere Application Server it is also possible to monitor the XU connection pool through the Tivoli Performance Viewer when it is enabled on the server.
From the WebSphere Application Server console, under "Monitoring and Tuning > Performance Viewer > Current activity", select the performance module "JCA Connection Pools > JRulesXU > eis/XUConnectionFactory" as in the example below:

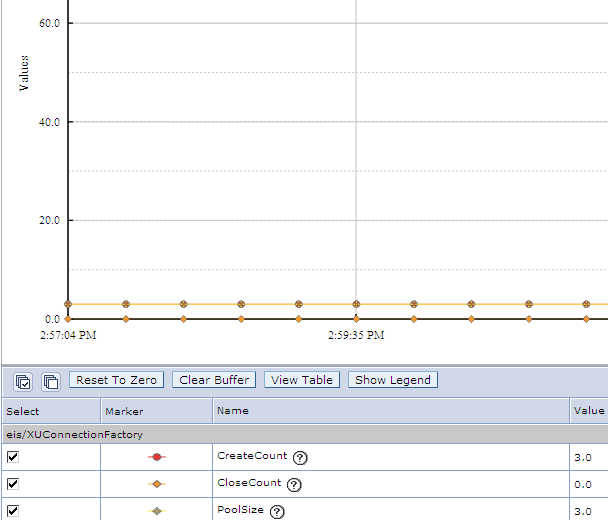
The Tivoli Performance Viewer then shows a graph of the XU connection pool size evolution in time:

It is also possible to capture the information in log files with the button "Start logging". For more information see Logging performance data with TPV.
The logs can be viewed through "Monitoring and Tuning > Performance Viewer > View logs" and by pointing to the log location ( by default logs are stored in <profile_home>/logs/tpv )
Related Information
Was this topic helpful?
Document Information
Modified date:
15 June 2018
UID
swg21585898