Troubleshooting
Problem
This document describes a non-invasive method of diagnosing the cause of a J2CA0045E error.
Symptom
If you have an application which is receiving
com.ibm.websphere.ce.cm.ConnectionWaitTimeoutException errors or J2CA0045E: Connection not available while invoking method queueRequest for resource jdbc/xxxxxx, then there is a possibility that the database connections are not being returned to the connection pool in a timely manner.Cause
A variety of different factors can cause a
J2CA0045E error to occur.Environment
In order to troubleshoot this error effectively, the WebSphere Application Server environment should be upgraded to a Fix Pack which includes APAR PK83902:
WebSphere Application Server v7.0.0.5
APAR PK83902 contains additional diagnostic code which enhances the serviceability of the WebSphere Application Server product.
The technique described below can be used in any environment where a WebSphere Application Server application uses a datasource to connect to a backend database.
Diagnosing The Problem
Prerequisite:
Upgrade the WebSphere Application Server environment to one of the above FixPacks (or higher).
Part 1:
Enable a diagnostic trace on the server.
It is best to enable a 'Runtime' trace instead of a 'Configuration' trace. This is so that the trace can be disabled once the diagnostic data has been retrieved from the server.
NOTE: A trace.log will be created, however, it will only contain messages similar in nature to what is logged to the SystemOut.log. It will not log continuous messages like a WAS.j2c=all trace and causes only slight performance impact.
Part 2:
Collect diagnostic data.
Let the system run and watch the SystemOut.log. If J2CA0045E messages are occurring or if connections appear to be stuck in the connection pool, then it is time to invoke wsadmin.
The following wsadmin commands can be used to dump the contents of the connection pool at any given time:
or
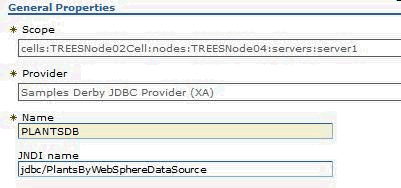
For example, the Plants By WebSphere Samples datasource is configured with these properties:

The wsadmin commands to view the pool contents for this datasource would be the following:
If you want to show the contents of a WebSphere MQ messaging provider JMS Queue Connection Factory's connection pool, you will need to alter the queryNames argument slightly. The 'name' will need to be preceded with a '
For example, if the display name of your Queue Connection Factory is
It is also possible to put the commands into a script which can be invoked at a regular interval to check the status of the connection pool over time. Using the PLANTSDB example above, here are the Windows commands to put into a script. The output is logged to the pool_contents.log file in the working directory:
Note: It might be necessary to provide options such as connection type, hostname, or port number to the wsadmin command invocation. Please review the wsadmin documentation for details on the syntax:
wsadmin scripting tool
Your output of the showPoolContents will display the stack trace of connections currently in use. The output will be similar to this (note: the below output does not match the above datasource example):
Upgrade the WebSphere Application Server environment to one of the above FixPacks (or higher).
Part 1:
Enable a diagnostic trace on the server.
It is best to enable a 'Runtime' trace instead of a 'Configuration' trace. This is so that the trace can be disabled once the diagnostic data has been retrieved from the server.
- Start the application server.
- Immediately after starting the server, enable a Runtime trace:
- In the WebSphere Application Server administrative console, expand the Troubleshooting section and click Logs and Trace.
- Click the link for your server.
- Click Diagnostic Trace.
- Click the Runtime tab.
- Click on Change Log Level Details.
- Click the Runtime tab.
- In Trace Specification, enter the following string:
ConnLeakLogic=all
Click OK. - Trace has now been dynamically enabled on the server.
NOTE: A trace.log will be created, however, it will only contain messages similar in nature to what is logged to the SystemOut.log. It will not log continuous messages like a WAS.j2c=all trace and causes only slight performance impact.
Part 2:
Collect diagnostic data.
Let the system run and watch the SystemOut.log. If J2CA0045E messages are occurring or if connections appear to be stuck in the connection pool, then it is time to invoke wsadmin.
The following wsadmin commands can be used to dump the contents of the connection pool at any given time:
wsadmin>set ds [$AdminControl queryNames "*:name=<INSERT DISPLAY NAME OF DATASOURCE HERE>,process=<SERVER NAME>,node=<NODE NAME>,j2eeType=JDBCDataSource,*"] wsadmin>$AdminControl invoke $ds showPoolContents or
C:\IBM\WebSphere\bin>wsadmin -c "$AdminControl invoke [$AdminControl queryNames \"*:name=<INSERT DISPLAY NAME OF DATASOURCE HERE>,process=<SERVER NAME>,node=<NODE NAME>,j2eeType=JDBCDataSource,*\"] showPoolContents" -user <adminuserid> -password <adminpw>For example, the Plants By WebSphere Samples datasource is configured with these properties:

The wsadmin commands to view the pool contents for this datasource would be the following:
wsadmin>set ds [$AdminControl queryNames "*:name=PLANTSDB,process=server1,node=TREESNode04,j2eeType=JDBCDataSource,*"]


"WebSphere:name=PLANTSDB,process=server1,platform=dynamicproxy,node=TREESNode04,JDBCProvider=Samples Derby JDBC Provider (XA),diagnosticProvider=true,j2eeType=JDBCDataSource,J2EEServer=server1,Server=server1,version=6.1.0.25,type=DataSource,mbeanIdentifier=cells/TREESNode02Cell/nodes/TREESNode04/servers/server1/resources.xml#DataSource_1243527981250,JDBCResource=Samples Derby JDBC Provider (XA),cell=TREESNode02Cell,spec=1.0"


wsadmin>$AdminControl invoke $ds showPoolContents
If you want to show the contents of a WebSphere MQ messaging provider JMS Queue Connection Factory's connection pool, you will need to alter the queryNames argument slightly. The 'name' will need to be preceded with a '
JMS\$ '.For example, if the display name of your Queue Connection Factory is
myQCF , the command would be the following:wsadmin>set cf [$AdminControl queryNames "*:name=JMS\$myQCF,process=<SERVER NAME>,node=<NODE NAME>,*"]
wsadmin>$AdminControl invoke $cf showPoolContents It is also possible to put the commands into a script which can be invoked at a regular interval to check the status of the connection pool over time. Using the PLANTSDB example above, here are the Windows commands to put into a script. The output is logged to the pool_contents.log file in the working directory:
C:\WebSphere\AppServer\bin>echo %DATE% %TIME% >> pool_contents.log

C:\WebSphere\AppServer\bin>wsadmin -c "$AdminControl invoke [$AdminControl queryNames \"*:name=PLANTSDB,process=server1,node=TREESNode04,j2eeType=JDBCDataSource,*\"] showPoolContents" -user my_adminuserid -password my_adminpw >> pool_contents.log
Note: It might be necessary to provide options such as connection type, hostname, or port number to the wsadmin command invocation. Please review the wsadmin documentation for details on the syntax:
wsadmin scripting tool
Your output of the showPoolContents will display the stack trace of connections currently in use. The output will be similar to this (note: the below output does not match the above datasource example):
WASX7209I: Connected to process "server1" on node TREESNode04 using SOAP connector; The type of process is: UnManagedProcess


PoolManager name:jdbc/sample

PoolManager object:28487215

Total number of connections: 5 (max/min 5/0, reap/unused/aged 180/1800/0, connectiontimeout/purge 180/EntirePool)

(testConnection/inteval false/0, stuck timer/time/threshold 0/0/0, surge time/connections 0/-1)

The waiter count is 4

The mcWrappers in waiter queue []

Shared Connection information (shared partitions 300)

com.ibm.ws.LocalTransaction.LocalTranCoordImpl@e07499;SUSPENDED; MCWrapper id 1fd7c23 Managed connection WSRdbManagedConnectionImpl@e11f7a State:STATE_TRAN_WRAPPER_INUSE Thread Id: 0000003e Thread Name: WebContainer : 3 Handle count 0 Start time inuse Wed Sep 02 21:03:13 EDT 2009 Time inuse 157 (seconds)

com.ibm.ws.LocalTransaction.LocalTranCoordImpl@157e52e;SUSPENDED; MCWrapper id 11b78de Managed connection WSRdbManagedConnectionImpl@9c5f65 State:STATE_TRAN_WRAPPER_INUSE Thread Id: 0000003e Thread Name: WebContainer : 4 Handle count 0 Start time inuse Wed Sep 02 21:03:13 EDT 2009 Time inuse 157 (seconds)

com.ibm.ws.LocalTransaction.LocalTranCoordImpl@7ba4b2;SUSPENDED; MCWrapper id 86332d Managed connection WSRdbManagedConnectionImpl@89ef6c State:STATE_TRAN_WRAPPER_INUSE Thread Id: 0000003e Thread Name: WebContainer : 5 Handle count 0 Start time inuse Wed Sep 02 21:03:12 EDT 2009 Time inuse 158 (seconds)

com.ibm.ws.LocalTransaction.LocalTranCoordImpl@1d68191;SUSPENDED; MCWrapper id 15e5933 Managed connection WSRdbManagedConnectionImpl@1322b26 State:STATE_TRAN_WRAPPER_INUSE Thread Id: 0000003e Thread Name: WebContainer : 6 Handle count 0 Start time inuse Wed Sep 02 21:03:12 EDT 2009 Time inuse 158 (seconds)

com.ibm.ws.LocalTransaction.LocalTranCoordImpl@81e7e9;SUSPENDED; MCWrapper id 1cbd4ee Managed connection WSRdbManagedConnectionImpl@1087b1b State:STATE_TRAN_WRAPPER_INUSE Thread Id: 0000003e Thread Name: WebContainer : 7 Handle count 0 Start time inuse Wed Sep 02 21:03:13 EDT 2009 Time inuse 157 (seconds)


Total number of connection in shared pool: 5

Free Connection information (free distribution table/partitions 3/1)


No free connections


UnShared Connection information

No unshared connections


Connection Leak Logic Information:
Resolving The Problem
Interpreting the Data:
The showPoolContents data contains several pieces of useful data.
Total number of connections- this is the sum of the connections in the Shared, UnShared and Free Connection Poolswaiter count- the number of connection requests which are waiting for free connection to be returned from the connection poolTotal number of connections in [ shared | unshared | free ] pool- the number of connections which are currently in the various poolsConnection Leak Logic Information- if a connection has been in use for more than 10 seconds, then the stack trace of the code which obtained the connection will appear in this list.Shared Connection information- let's look at the relevant parts of this output individually:
com.ibm.ws.LocalTransaction.LocalTranCoordImpl@e07499;SUSPENDED; MCWrapper id 1fd7c23 Managed connection WSRdbManagedConnectionImpl@e11f7a State:STATE_TRAN_WRAPPER_INUSE Thread Id: 0000003e Thread Name: WebContainer : 3 Handle count 0 Start time inuse Wed Sep 02 21:03:13 EDT 2009 Time inuse 157 (seconds)
com.ibm.ws.LocalTransaction.LocalTranCoordImpl@e07499;SUSPENDED--> The transactional scope under which the connection was obtained. This connection was obtained inside a LocalTransactionContainment (LTC). If the connection was obtained in a global transaction, the output would look like this:
com.ibm.ws.Transaction.JTA.TransactionImpl@24c17ad2#tid=812
State:STATE_TRAN_WRAPPER_INUSE--> Transactional state of the connection
Thread Id: 0000003e Thread Name: WebContainer : 3--> The thread id and the thread name on which the connection was used. This can be useful when correlating data from javacores taken at the same time.
Handle count--> When this value is 1, it means that the application has not yet issued a connection.close(). When this value is 0, the application has already issued a connection.close().
Start time inuse--> The time and date of when the connection was first obtained from the connection pool by this thread.
Time inuse--> The amount of time the connection has been in use.
Related Information
[{"Product":{"code":"SSEQTP","label":"WebSphere Application Server"},"Business Unit":{"code":"BU059","label":"IBM Software w\/o TPS"},"Component":"DB Connections\/Connection Pooling","Platform":[{"code":"PF002","label":"AIX"},{"code":"PF010","label":"HP-UX"},{"code":"PF016","label":"Linux"},{"code":"PF027","label":"Solaris"},{"code":"PF033","label":"Windows"}],"Version":"9.0;8.5.5;8.0;7.0","Edition":"Base;Network Deployment","Line of Business":{"code":"LOB45","label":"Automation"}}]
Was this topic helpful?
Document Information
Modified date:
15 April 2023
UID
swg21385033